NAR: Pending Home Sales Falter 2.2% in September
Pending home sales experienced a minor decline in September after four consecutive months of contract activity growth, according to the National Association of Realtors®. While all four major U.S. regions recorded notable year-over-year increases, only the Northeast achieved month-over-month gains in pending home sales transactions.
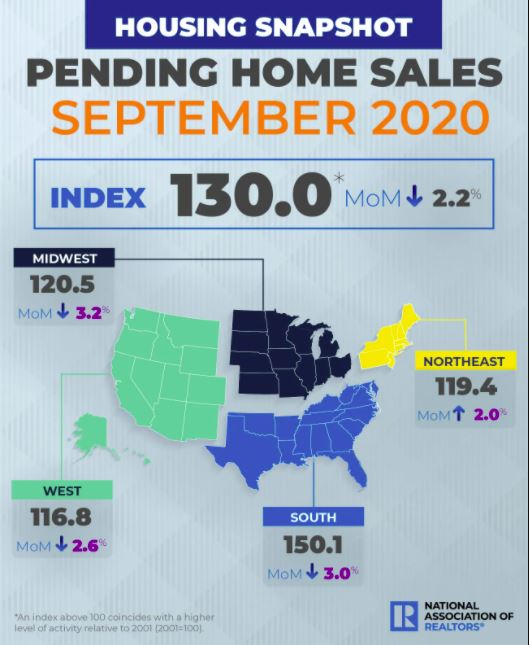
The Pending Home Sales Index (PHSI),* www.nar.realtor/pending-home-sales, a forward-looking indicator of home sales based on contract signings, fell 2.2% to 130.0 in September. Year-over-year, contract signings rose 20.5%. An index of 100 is equal to the level of contract activity in 2001.
“The demand for home buying remains super strong, even with a slight monthly pullback in September, and we’re still likely to end the year with more homes sold overall in 2020 than in 2019,” said Lawrence Yun, NAR’s chief economist. “With persistent low mortgage rates and some degree of a continuing jobs recovery, more contract signings are expected in the near future.”
“Additionally, a second-order demand will steadily arise as homeowners who had not considered moving before the pandemic begin to enter the market,” Yun said. “A number of these owners are contemplating moving into larger homes in less densely populated areas in light of new-found work-from-home flexibility.”
Realtor.com®’s Housing Market Recovery Index, which reveals metro areas where the market has recovered or even exceeded its previous January levels, showed the greatest recoveries as of October 10 were in Seattle-Tacoma-Bellevue, Wash.; Boston-Cambridge-Newton, Mass.-N.H.; Los Angeles-Long Beach-Anaheim, Calif.; Las Vegas-Henderson-Paradise, Nev.; and San Jose-Sunnyvale-Santa Clara, Calif.
September Pending Home Sales Regional Breakdown
Three of four regional indices recorded decreases in contract activity on a month-over-month basis in September.
The Northeast PHSI grew 2.0% to 119.4 in September, a 27.7% increase from a year ago. In the Midwest, the index slid 3.2% to 120.5 last month, up 18.5% from September 2019.
Pending home sales in the South decreased 3.0% to an index of 150.1 in September, up 19.6% from September 2019. The index in the West fell 2.6% in September to 116.8, up 19.3% from a year ago.
The National Association of Realtors® is America’s largest trade association, representing more than 1.4 million members involved in all aspects of the residential and commercial real estate industries.
# # #
*The Pending Home Sales Index is a leading indicator for the housing sector, based on pending sales of existing homes. A sale is listed as pending when the contract has been signed but the transaction has not closed, though the sale usually is finalized within one or two months of signing.
The index is based on a large national sample, typically representing about 20% of transactions for existing-home sales. In developing the model for the index, it was demonstrated that the level of monthly sales contract activity parallels the level of closed existing-home sales in the following two months.
An index of 100 is equal to the average level of contract activity during 2001, which was the first year to be examined. By coincidence, the volume of existing-home sales in 2001 fell within the range of 5.0 to 5.5 million, which is considered normal for the current U.S. population.
NOTE: Existing-Home Sales for October will be reported November 19. The next Pending Home Sales Index will be November 30; all release times are 10:00 a.m. ET.
Source: National Association of REALTORS
The Value of Membership

As the leading provider of in-depth business and credit information on the domestic lumber & forest products industry, a membership with Blue Book Services gives you access to:
- Ratings & Business Reports
- Dynamic Search Tools
- Real-Time Data