Statistics Canada: Building Permits, May 2021
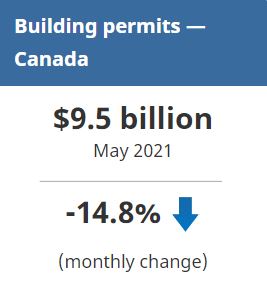
Following four consecutive months of reaching new highs, the total value of building permits dropped a record $1.6 billion (-14.8%) to $9.5 billion in May. Every component was down, with multi-family dwellings in Ontario accounting for nearly three fifths of the overall national decline.
On a constant dollar basis (2012=100), building permits decreased 14.5% to $7.1 billion.
Multi-family permits in Ontario pull residential sector down
The value of permits for multi-family dwellings dropped 20.6% to $3.3 billion in May, the lowest value since August 2020. Ontario was responsible for the majority of the decline.
All provinces except for Newfoundland and Labrador posted a decrease in the value of permits issued for single-family dwellings, which fell 10.6% nationally to $3.2 billion. Quebec accounted for almost half of the national decline, with fewer permits issued in municipalities outside of the census metropolitan areas.
Overall, the value of permits issued in the residential sector pulled back 16.0% to $6.5 billion.
Non-residential permits drop due to Ontario and Quebec
Construction intentions for the non-residential sector were down 12.2% to $3.0 billion in May, with Ontario and Quebec falling 21.5% and 22.9% respectively.
Commercial permits tumbled 15.8% to $1.6 billion overall. Ontario dropped 33.9% as no permit in excess of $25 million was issued for the province in May, compared with six in the previous month, worth a total of $295 million.
The value of permits issued for industrial buildings fell 14.6% to $511 million. Seven provinces reported a decline in this component, with Quebec recording the largest decrease. Quebec saw an uptick in April, largely due to a $105 million permit issued for renovations to a mining facility in the municipality of Sept-Îles.
The value of institutional permits decreased 3.4% to $900 million. Gains in four provinces, led by British Columbia and Manitoba, were not enough to counter a $115 million decline observed in Quebec.
To explore data using an interactive user interface, visit the Building permits: Interactive Dashboard.
To explore the impact of COVID-19 on the socioeconomic landscape, please consult the Canadian Economic Dashboard and COVID-19.
For more information on housing, please visit the Housing Statistics Portal.
Statistics Canada has a Housing Market Indicators dashboard. This Web application provides access to key housing market indicators for Canada, by province and by census metropolitan area. These indicators are updated automatically with new information from monthly releases, giving users access to the latest data.
To read the full report, click here.
Note to readers:
Unless otherwise stated, this release presents seasonally adjusted data with current dollar values, which facilitate month-to-month comparisons by removing the effects of seasonal variations. For information on seasonal adjustment, see Seasonally adjusted data – Frequently asked questions.
Starting with the March 2021 reference period, monthly constant dollar estimates have been made available for the entire data series (34-10-0066-01). Constant dollars remove the effects of price changes over time and are calculated using quarterly deflators from the Building Construction Price Index (18-10-0135-01). Typically, the first two months of a quarter use the previous quarter’s price level and are revised when the new quarterly price index becomes available.
Building components
– Single-family dwellings: Residential buildings containing only one dwelling unit (for example, single-detached house, bungalow, linked home [linked at the foundation]).
– Multi-family dwellings: Residential buildings containing multiple dwelling units (for example, apartment, apartment condominium, row house, semi-detached house).
– Industrial buildings: Buildings used in the processing or production of goods, or related to transportation and communication.
– Commercial buildings: Buildings used in the trade or distribution of goods and services.
– Institutional and government buildings: Buildings used to house public and semi-public services, such as those related to health and welfare, education, or public administration, as well as buildings used for religious services.
Revision
Unadjusted data for the current reference month are subject to revision based on late responses. Data for the previous month have been revised. Seasonally adjusted data for the previous two months have also been revised.
Trend-cycle estimates have been added to the charts as a complement to the seasonally adjusted series. Both seasonally adjusted data and trend-cycle estimates are subject to revision as additional observations become available. These revisions could be large and could even lead to a reversal of movement, especially at the end of the series. The higher variability associated with trend-cycle estimates is indicated with a dotted line on the chart.
For information on trend-cycle data, see the StatCan Blog and Trend-cycle estimates – Frequently asked questions.
Next release
Data on building permits for June will be released on August 4.
Source: Statistics Canada
The Value of Membership

As the leading provider of in-depth business and credit information on the domestic lumber & forest products industry, a membership with Blue Book Services gives you access to:
- Ratings & Business Reports
- Dynamic Search Tools
- Real-Time Data