Statistics Canada: Building Permits, July 2022
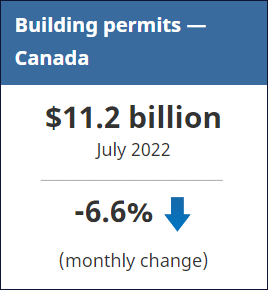
The total value of building permits in Canada declined 6.6% in July to $11.2 billion, mainly due to the residential sector, which fell 8.6% to $7.6 billion. The non-residential sector also dropped slightly by 2.1%.
On a constant dollar basis (2012=100), the total value of building permits decreased 4.8% to $6.9 billion.
Ontario pushes down residential sector
In July, residential permits decreased 8.6% to $7.6 billion nationally. Strong gains in British Columbia and Quebec were more than offset by weak construction intentions in six other provinces.
Construction intentions in the single-family homes component declined 5.7%, as decreases in Ontario (-13.9%) more than offset the gains in six provinces. Despite the decline, this component remained 14.8% higher than the same month of 2021.
The value of building permits in the multi-family homes component dropped 11.1%. Declines were posted in six provinces, with Ontario (-32.8%) reporting the largest decrease. Conversely, British Columbia had a number of permits for condos and apartments, pushing the province’s permits value up 9.3%.
Industrial component drags down non-residential sector
In July, the total permit value of the non-residential sector decreased 2.1% to $3.6 billion. Gains in the commercial and institutional components were more than offset by losses in the industrial component.
The value of building permits in the industrial component tumbled 16.9%, largely due to Ontario (-31.1%), which had its third consecutive monthly decline. After nearing the billion-dollar mark back in January and April, the component has returned to more typical levels.
Commercial permit values edged up 0.1%; Alberta (+72.8%) had the highest increase, stemming from various permits issued in Calgary and Edmonton.
Construction intentions in the institutional component jumped 7.9%, with British Columbia (+207.2%) leading the charge. Weak results in June, as well as several large permits, contributed to the significant increase in July.
Spotlight on Newfoundland and Labrador
The value of residential permits, along with the number of units in Newfoundland and Labrador, has been on a downward trend since its peak in early 2010, with the lowest values for the series observed at the beginning of the COVID-19 pandemic. This trend has been impacting both single- and multi-family dwellings similarly. A small recovery has been observed during the pandemic, but the recovery has been mainly driven by an increase in construction costs.
Newfoundland and Labrador’s population has remained relatively consistent at around 520,000 since 2010 (table 17-10-0009-01), leading to a smaller demand for new houses. In contrast, other provinces have had notable increases in both population and number of units during the same time period.
Since 2010, non-residential permits for the province have also been on a downward trend. On an annual basis, from 2010 to the end of 2021, the total value of permits for the sector in Newfoundland and Labrador has decreased 59.0%, while Canada, excluding the province of Newfoundland and Labrador, has jumped 38.0%.
To explore data using an interactive user interface, visit the Building permits: Interactive Dashboard.
To explore the impact of the COVID-19 pandemic on the socioeconomic landscape, please consult the Canadian Economic Dashboard and COVID-19.
For more information on housing, please visit the Housing statistics portal.
Statistics Canada has a Housing Market Indicators dashboard. This web application provides access to key housing market indicators for Canada, by province and by census metropolitan area. The indicators are updated automatically with new information from monthly releases, giving users access to the latest data.
To read the full report, click here.
Note to readers
Unless otherwise stated, this release presents seasonally adjusted data with current dollar values, which facilitate month-to-month and quarter-to-quarter comparisons by removing the effects of seasonal variations. For information on seasonal adjustment, see Seasonally adjusted data – Frequently asked questions.
Building components
- Single-family dwellings: Residential buildings containing only one dwelling unit (e.g., single-detached house, bungalow, linked home [linked at the foundation]).
- Multi-family dwellings: Residential buildings containing multiple dwelling units (e.g., apartment, apartment condominium, row house, semi-detached house).
- Industrial buildings: Buildings used in the processing or production of goods, or related to transportation and communication.
- Commercial buildings: Buildings used in the trade or distribution of goods and services, including office buildings.
- Institutional and government buildings: Buildings used to house public and semi-public services, such as those related to health and welfare, education, or public administration, as well as buildings used for religious services.
Revision
Data are subject to revisions based on late responses, methodological changes and classification updates. Unadjusted data has been revised for the previous month. Seasonally adjusted data has been revised for the previous three months.
For information on trend-cycle data, see the StatCan Blog and Trend-cycle estimates – Frequently asked questions.
Next release
Data on building permits for August will be released on October 5th.
Source: Statistics Canada
The Value of Membership

As the leading provider of in-depth business and credit information on the domestic lumber & forest products industry, a membership with Blue Book Services gives you access to:
- Ratings & Business Reports
- Dynamic Search Tools
- Real-Time Data