Statistics Canada: Building Permits February 2023
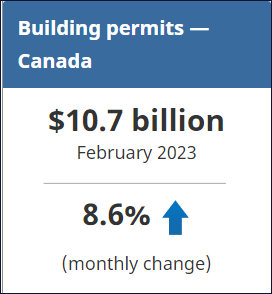
The total value of building permits in Canada advanced 8.6% to $10.7 billion in February, indicating robust intentions for both the residential (+7.9% to $6.6 billion) and non-residential (+9.8% to $4.2 billion) sectors.
Seven provinces reported monthly increases, with notable gains in Ontario (+10.7%) and Alberta (+25.6%).
On a constant dollar basis (2012=100), the total value of building permits went up 8.2% to $6.4 billion.
Residential sector breaks two-month dip, advanced by multi-dwelling permits
The multi-dwelling component sharply increased by 13.6%, led by a variety of large value permits in Ontario (+25.4%).
Meanwhile, construction intentions in single-family homes remained stable (+0.5%).
Overall, residential permits gained 7.9% to $6.6 billion. Permits were issued for 22,900 new units nationally, 3,600 more than the intentions reported in January.
All four eastern provinces saw gains in the value of permits, collectively advancing 25.7% month over month. Conversely, British Columbia (-13.4%), Alberta (-3.9%) and Saskatchewan (-40.6%) reported monthly declines in residential permits.
Alberta bolsters non-residential growth
The total monthly value of non-residential permits increased 9.8% to $4.2 billion, the highest non-residential value since February 2022. Much of this gain is attributable to several high-value projects in Alberta.
Across the country, gains in the industrial (+42.0%) and commercial (+6.2%) components more than offset losses in the institutional (-7.6%) component.
To explore data using an interactive user interface, visit the Building permits: Interactive Dashboard.
For more information on construction, please visit the Construction statistics portal.
For more information on housing, please visit the Housing statistics portal.
Statistics Canada has a Housing Market Indicators dashboard. This web application provides access to key housing market indicators for Canada, by province and by census metropolitan area. The indicators are updated automatically with new information from monthly releases, giving users access to the latest data.
Note to readers
Unless otherwise stated, this release presents seasonally adjusted data with current dollar values, which facilitate month-to-month and quarter-to-quarter comparisons by removing the effects of seasonal variations. For information on seasonal adjustment, see Seasonally adjusted data – Frequently asked questions.
Building components
- Single-family dwellings: Residential buildings containing only one dwelling unit (e.g., single-detached house, bungalow, linked home [linked at the foundation]).
- Multi-family dwellings: Residential buildings containing multiple dwelling units (e.g., apartment, apartment condominium, row house, semi-detached house).
- Industrial buildings: Buildings used in the processing or production of goods or related to transportation and communication.
- Commercial buildings: Buildings used in the trade or distribution of goods and services, including office buildings.
- Institutional and government buildings: Buildings used to house public and semi-public services, such as those related to health and welfare, education or public administration, and buildings used for religious services.
Revision
Data are subject to revisions based on late responses, methodological changes and classification updates. Unadjusted data has been revised for the previous month. Seasonally adjusted data has been revised for the previous three months.
For information on trend-cycle data, see the StatCan Blog and Trend-cycle estimates – Frequently asked questions.
Next release
Data on building permits for March will be released on May 10.
Source: Statistics Canada
The Value of Membership

As the leading provider of in-depth business and credit information on the domestic lumber & forest products industry, a membership with Blue Book Services gives you access to:
- Ratings & Business Reports
- Dynamic Search Tools
- Real-Time Data