NAR: Pending Home Sales Dip 1.1% in October
Pending home sales fell slightly in October, according to the National Association of Realtors. Contract activity was mixed among the four major U.S. regions, with the only positive month-over-month growth happening in the South, although each region achieved year-over-year gains in pending home sales transactions.
Key Highlights
– Pending home sales declined slightly in October, slipping 1.1% from September. Only the South had month-over-month gains.
– Nationally, contract signings are up 20.2% compared to a year ago.
– All regions experienced double-digit year-over-year increases.
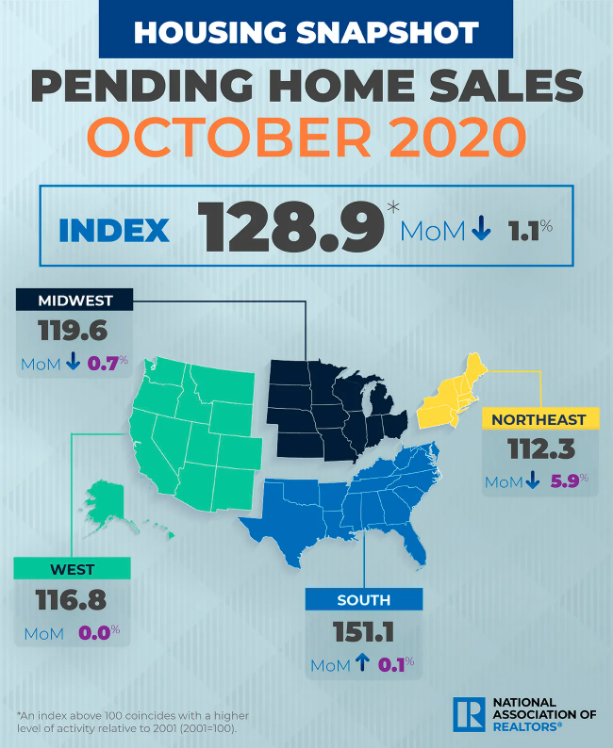
In October 2020, pending home sales were down 1.1% month-over-month.
The Pending Home Sales Index (“PHSI”),* www.nar.realtor/pending-home-sales, a forward-looking indicator of home sales based on contract signings, fell 1.1% to 128.9 in October, the second straight month of decline. Year-over-year, contract signings rose 20.2%. An index of 100 is equal to the level of contract activity in 2001.
“Pending home transactions saw a small drop off from the prior month but still easily outperformed last year’s numbers for October,” said Lawrence Yun, NAR’s chief economist. “The housing market is still hot, but we may be starting to see rising home prices hurting affordability.”
Both the inventory of homes for sale and mortgage rates are now at historic lows, according to Yun.
“The combination of these factors – scarce housing and low rates – plus very strong demand has pushed home prices to levels that are making it difficult to save for a down payment, particularly among first-time buyers, who don’t have the luxury of using housing equity from a sale to use as a down payment,” said Yun. “Work-from-home flexibility has also increased the demand for both primary and secondary homes.”
Realtor.com®’s Housing Market Recovery Index, which reveals metro areas where the market has recovered or even exceeded January 20 levels, showed Las Vegas-Henderson-Paradise, Nev.; San Francisco, Calif.; Seattle-Tacoma-Bellevue, Wash.; San Jose-Sunnyvale-Santa Clara, Calif.; and Los Angeles-Long Beach-Anaheim, Calif., had enjoyed the most significant recovery as of November 14.
October Pending Home Sales Regional Breakdown
The Northeast PHSI slid 5.9% to 112.3 in October, a 18.5% increase from a year ago. In the Midwest, the index fell 0.7% to 119.6 last month, up 19.6% from October 2019.
Pending home sales in the South increased 0.1% to an index of 151.1 in October, up 21.0% from October 2019. The index in the West remained the same in October, at 116.8, which is up 20.8% from a year ago.
The National Association of Realtors® is America’s largest trade association, representing more than 1.4 million members involved in all aspects of the residential and commercial real estate industries.
# # #
*The Pending Home Sales Index is a leading indicator for the housing sector, based on pending sales of existing homes. A sale is listed as pending when the contract has been signed but the transaction has not closed, though the sale usually is finalized within one or two months of signing.
The index is based on a large national sample, typically representing about 20% of transactions for existing-home sales. In developing the model for the index, it was demonstrated that the level of monthly sales contract activity parallels the level of closed existing-home sales in the following two months.
An index of 100 is equal to the average level of contract activity during 2001, which was the first year to be examined. By coincidence, the volume of existing-home sales in 2001 fell within the range of 5.0 to 5.5 million, which is considered normal for the current U.S. population.
NOTE: Existing-Home Sales for November will be reported December 22. The next Pending Home Sales Index will be December 30; all release times are 10:00 a.m. ET.
The Value of Membership

As the leading provider of in-depth business and credit information on the domestic lumber & forest products industry, a membership with Blue Book Services gives you access to:
- Ratings & Business Reports
- Dynamic Search Tools
- Real-Time Data