Fastenal Company Reports 2021 First Quarter Earnings

Fastenal Company, a leader in the wholesale distribution of industrial and construction supplies, today announced its financial results for the quarter ended March 31, 2021. Except for share and per share information, or as otherwise noted below, dollar amounts are stated in millions. Throughout this document, percentage and dollar calculations, which are based on non-rounded dollar values, may not be able to be recalculated using the dollar values included in this document due to the rounding of those dollar values.
Quarterly Results of Operations
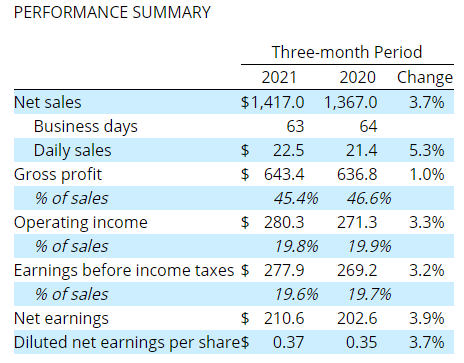
Net sales increased $50.0, or 3.7%, in the first quarter of 2021 when compared to the first quarter of 2020. There was one fewer selling day in the current period relative to the year earlier period, and taking this into consideration our net daily sales growth increased 5.3% in the first quarter of 2021 when compared to the first quarter of 2020. This growth was largely due to higher unit sales, most notably of fastener, safety, and janitorial products. Growth in fastener products reflected further improvement in demand among traditional industrial and construction customers and an easy comparison with respect to March 2021, which came against a year earlier period that experienced the onset of pandemic-related weakness and a contraction in fastener product growth. Growth in safety products reflected continued improvement in demand among traditional industrial and construction customers as well as sales to new customers that had not purchased safety products from Fastenal prior to the pandemic. Growth in our other products lines primarily reflected good demand for janitorial products, driven by similar variables experienced for our safety products. These favorable factors were partly offset by severe weather in February 2021, which we believe reduced net and daily sales growth by 50 to 100 basis points in the first quarter of 2021 compared to the first quarter of 2020.
The overall impact of product pricing on net sales in the first quarter of 2021 was 60 to 90 basis points. Pressures related to product cost inflation are rising, however, and we anticipate taking pricing actions in the second quarter of 2021 to mitigate these effects. Foreign exchange favorably impacted sales in the first quarter of 2021 by 60 basis points.
Daily sales of fastener products grew 4.0% over the first quarter of 2020, and represented 32.5% of our net sales in the first quarter of 2021; fasteners represented 32.9% of net sales in the first quarter of 2020. Daily sales of our safety products grew 14.7% over the first quarter of 2020 and represented 21.5% of our net sales in the first quarter of 2021; safety products represented 19.8% of net sales in the first quarter of 2020. Daily sales of our other products grew 2.5% over the first quarter of 2020 and represented 46.0% of our net sales in the first quarter of 2021; other products represented 47.3% of net sales in the first quarter of 2020.
Daily sales to our national account customers (defined as customer accounts with a multi-site contract) grew 6.9% in the first quarter of 2021 over the first quarter of 2020. Revenues attributable to national account customers represented 56.3% of our total revenues in the period. Daily sales to our non-national account customers, which includes government customers, grew 3.1% in the first quarter of 2021 over the first quarter of 2020. Revenues attributable to non-national account customers represented 43.7% of our total revenues in the period.
In March 2020, and specifically the back half of that month, governments and businesses began to enact policies aimed at mitigating the effects of the COVID-19 pandemic, which also weakened business activity and the performance of our more cyclical product lines, such as fasteners. At the same time, the building global pandemic began to elevate demand for personal protective equipment (PPE) to support medical personnel, first responders and essential workers, resulting in an increase in demand for safety products. For these reasons, in March 2020 we experienced meaningful erosion in demand for fastener products and meaningful acceleration in demand for safety products relative to what had been experienced in January and February 2020. In contrast, and reflecting in part the comparisons each product category faced, in March 2021 we experienced meaningful acceleration in demand for fastener products and meaningful deceleration in demand for safety products relative to what had been experienced in January and February 2021. We believe the shift that was evident in March 2021 may become more pronounced in the second quarter of 2021.
Our gross profit, as a percentage of net sales, declined 120 basis points to 45.4% in the first quarter of 2021 from 46.6% in the first quarter of 2020. This decline reflects several items. First, we wrote down the value of the 3-ply masks that remain in inventory by $7.8, reducing gross profit, as a percentage of net sales, by 50 basis points. From April 2020 to March 2021, we profitably sold roughly $110.0 in 3-ply masks, a product we sold very little of prior to that period, and we continue to have demand for these masks and to sell through our inventory. However, the surplus of product that has entered the market has pushed prices below original cost, a condition we anticipate will persist. Second, the impact of product and customer mix reduced our gross profit percentage, though the rate moderated versus preceding periods as fastener growth began to outpace non-fastener growth toward the end of the first quarter of 2021. Third, product margins were slightly lower in the first quarter of 2021 versus the first quarter of 2020. Safety product margin was lower due to the continued presence of lower margin COVID-related PPE in the mix. Fastener product margin was lower due to faster growth among larger customers and purchases outside our traditional supply chain as a means of navigating supply chain challenges. These variables were partly offset by improvements in overhead/organizational leverage due to improving business conditions.
Our operating income, as a percentage of net sales, decreased to 19.8% in the first quarter of 2021 from 19.9% in the first quarter of 2020. The 10 basis point decline in gross profit percentage experienced in the first quarter of 2021 reflects the 120 basis point decline in gross profit, as a percentage of sales, mostly offset by leveraging our operating and administrative expenses, as a percentage of sales, which declined 110 basis points to 25.6% in the first quarter of 2021 from 26.7% in the first quarter of 2020. We experienced modest leverage in each of our employee, occupancy, and general corporate expense categories.
Employee-related expenses, which represents approximately 70% of total operating and administrative expenses, increased 1.8% in the first quarter of 2021 compared to the first quarter of 2020. The increase was primarily due to higher profit sharing to reflect a more favorable sales and profit outlook and, to a lesser extent, slightly higher incentive compensation. This was partly offset by slightly lower base compensation as a result of lower FTE headcount during the period as part of our efforts to control expenses. Occupancy-related expenses, which represent 15% to 20% of total operating and administrative expenses, were mostly unchanged in the first quarter of 2021 compared to the first quarter of 2020. A modest increase in non-branch facility expenses was largely offset by slightly lower vending repair costs. Combined, all other operating and administrative expenses, which represent 10% to 15% of total operating and administrative expenses, decreased 15.2% in the first quarter of 2021 compared to the first quarter of 2020. We experienced lower costs for selling-related transportation due to tight fleet maintenance expenses and efforts to rationalize our local pick-up fleet. We also continued to experience reduced costs for travel, meals, and supplies, as well as favorable bad debt trends. These benefits were partially offset by increases in spending on information technology.
Our net interest expense was $2.4 in the first quarter of 2021 compared to $2.1 in the first quarter of 2020. We experienced higher average debt levels through the period, which were offset by lower interest rates, as compared to the first quarter of 2020.
We recorded income tax expense of $67.3 in the first quarter of 2021, or 24.2% of earnings before income taxes. Income tax expense was $66.6 in the first quarter of 2020, or 24.7% of earnings before income taxes. We believe our ongoing tax rate, absent any discrete tax items or broader changes to tax law, will be in the 24.5% to 25.0% range. Our tax rate in the first quarter of 2021 was below this range largely due to the tax benefits associated with the exercise of stock options.
Our net earnings during the first quarter of 2021 were $210.6, an increase of 3.9% compared to the first quarter of 2020. Our diluted net earnings per share were $0.37 during the first quarter of 2021 compared to $0.35 during the first quarter of 2020, an increase of 3.7%.
Growth Driver Performance
— We signed 68 new Onsite locations (defined as dedicated sales and service provided from within, or in close proximity to, the customer’s facility) during the first quarter of 2021. Though this is a decline from 85 new Onsite signings in the first quarter of 2020, it also represents the highest rate of quarterly signings since the onset of the pandemic. We had 1,285 active sites on March 31, 2021, which represented an increase of 9.0% from March 31, 2020. Daily sales through our Onsite locations, excluding sales transferred from branches to new Onsites, increased at a mid-to-high single-digit rate in the first quarter of 2021 over the first quarter of 2020. The increase in sales reflects largely the contributions of our newest Onsites, as sales at our older sites remained down versus the year earlier period, though the rate of decline continued to moderate relative to preceding quarters. We continue to believe the market can support annual signings of 375 to 400 Onsites. However, in light of the level of signings in the first quarter of 2021 and continued lengthening of the sales cycle as a result of COVID-19, we believe Onsite signings in 2021 are more likely to fall between 300 and 350 locations.
— Fastenal Managed Inventory (FMI) is comprised of our FAST Vend (vending devices), FAST Bin (infrared, RFID, and scaled bins), and FAST Stock (scanned bins) offering. Prior to 2021, we reported exclusively on the signings, installations, and sales of FAST Vend. Beginning with this release, and as detailed previously in our 2020 Form 10-K filing, we are disclosing a weighted FMI measure that combines the signings, installations, and sales of FAST Vend and FAST Bin into a standardized machine equivalent unit (MEU) based on the expected output of each type of device. Figures prior to 2021 may differ slightly from those provided in our 2020 Form 10-K filing based on minor changes we made to the conversion of absolute devices to weighted devices that we plan on using in all future periods.
In the first quarter of 2021, we signed 4,683 weighted FMI devices, largely in line with the 4,692 signed in the first quarter of 2020. On a business day basis, we signed 74 in the first quarter of 2021. Our installed weighted FMI device count on March 31, 2021 was 85,157, an increase of 7.5% over March 31, 2020. FAST Vend represented over 95% of our installed base of weighted devices in the first quarter of 2021, while its proportion of signings was in the mid 80% range. Daily sales through weighted FMI devices increased 9.0% in the first quarter of 2021, and represented 21.2% of net sales. Our goal for weighted FMI device signings in 2021 remains at a range of 23,000 to 25,000 MEUs, though conditions for signings will need to continue to improve beyond the first quarter of 2021 to achieve this range.
Revenues attributed to all of our FMI tools, including FAST Stock, represented 29.0% of sales in the first quarter of 2021.
All metrics provided above exclude approximately 13,000 non-weighted vending devices that are part of a leased locker program.
— Our e-commerce business includes sales made through an electronic data interface (EDI) with our customers or through the web. It does not include sales through FMI, though we do consider these to be digital connections between ourselves and our customers. Daily sales through e-commerce grew 35.5% in the first quarter of 2021 over the first quarter of 2020. Revenues attributable to e-commerce represented 12.2% of our total revenues in the period.
Combined, 34.8% of our sales were generated digitally in the first quarter of 2021. We view our digital sales to be a combination of our sales through FMI (FAST Vend, FAST Bin, and FAST Stock) plus that proportion of our e-commerce sales that do not represent billings of FMI services.
Balance Sheet and Cash Flow
We produced operating cash flow of $274.8 in the first quarter of 2021, an increase of 14.0% from the first quarter of 2020, representing 130.5% of the period’s net earnings versus 119.0% in the first quarter of 2020. The most significant contributor to the increase in our operating cash flow as a percentage of net earnings was relatively more measured growth in working capital compared to the prior period. The impact of improving demand on our customer’s working capital needs was mitigated by internal efforts to streamline inventory, a lower rate of growth in the installed base of Onsites and weighted FMI devices, and improved receivables collections.
Accounts receivable were $851.0 at the end of the first quarter of 2021, an increase of $17.2, or 2.1%, over the first quarter of 2020. Our receivables balance increased as a result of higher sales, partly offset by improvement in collection of past due balances. Inventory was $1,305.3 at the end of the first quarter of 2021, a decrease of $40.2, or 3.0%, over the first quarter of 2020. The decrease in our inventory balance was due to several factors: First, further consolidation of our traditional branch count, with 142 closings over the past 12 months. Second, efforts to better match stock to the needs of specific markets, reduce slow- or non-moving inventory, and improve the flow of product through our internal logistics. Third, relatively slow signings in 2020 of Onsites and weighted FMI devices, particularly vending, reduced the rate of growth in our installed base and the inventory that would have been necessary to support it. Accounts payable were $215.1 at the end of the first quarter of 2021, an increase of $2.9, or 1.4%, over the first quarter of 2020. The increase in our payables balance largely reflects growth in our business.
Our investment in property and equipment, net of proceeds from sales, was $30.0 in the first quarter of 2021 compared to $46.7 in the first quarter of 2020. This decrease was primarily a result of lower spending on vending devices to reflect a pandemic-related decline in vending signings and installations and reduced equipment costs following the March 2020 acquisition of the industrial vending assets of Apex Industrial Technologies LLC (Apex). We continue to expect our net capital expenditures (property and equipment net of proceeds from sales) in 2021 to be within a range of $170.0 to $200.0, an increase from $157.5 in 2020. This increase relates to increased spending for a non-hub construction project in Winona to support growth, higher spending for equipment and facility upgrades, retrofits, and replacement across most tracked categories, and lower anticipated proceeds from asset sales.
We returned $160.8 to our shareholders in the form of dividends in the first quarter of 2021, compared to $195.6 to our shareholders in the first quarter of 2020 in the form of dividends ($143.6) and purchases of our common stock ($52.0).
Total debt on our balance sheet was $405.0 at the end of the first quarter of 2021, or 12.7% of total capital (the sum of stockholders’ equity and total debt). This compares to $455.0, or 14.6% of total capital, at the end of the first quarter of 2020.
Additional Information
The table below summarizes our total and FTE (based on 40 hours per week) employee headcount, our investments in in-market locations (defined as the sum of the total number of public branch locations and the total number of active Onsite locations), and weighted FMI devices at the end of the periods presented and the percentage change compared to the end of the prior periods.
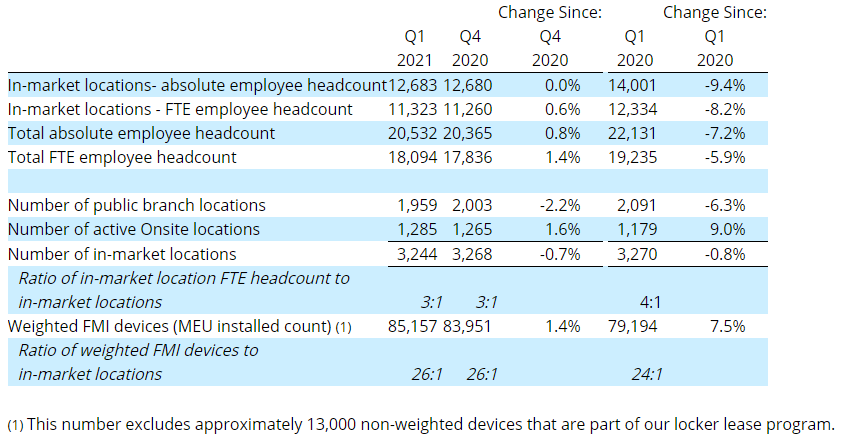
During the last twelve months, we reduced our total FTE employee headcount by 1,141. This reflects a decline in our in-market FTE employee headcount of 1,011, as well as declines in headcount at our distribution centers and manufacturing operations to reflect lower throughput. These reductions are primarily related to efforts to control expenses in response to weaker demand from traditional manufacturing and construction customers. This was only partly offset by additions in non-branch selling and support roles. The increase in non-branch selling largely reflects a reclassification of certain sales roles from in-market to non-in-market, and while strategic, does not constitute a net increase in headcount at the corporate level. The increase in support roles largely reflects increases in personnel in Information Technology, including employees added from our acquisition of certain assets of Apex, as well as roles to support customer acquisition and implementation.
We opened two branches in the first quarter of 2021 and closed 46 branches, net of conversions. We activated 48 Onsite locations in the first quarter of 2021 and closed 28, net of conversions. In any period, the number of closings tend to reflect both normal churn in our business, whether due to redefining or exiting customer relationships, the shutting or relocation of customer facilities that host our locations, or a customer decision, as well as our ongoing review of underperforming locations. Our in-market network forms the foundation of our business strategy, and we will continue to open or close locations as is deemed necessary to sustain and improve our network, support our growth drivers, and manage our operating expenses.
For the full first quarter results, click here.
Contact:
Ellen Stolts – Assistant Controller – (507) 313-7282
Source: Fastenal Company
The Value of Membership

As the leading provider of in-depth business and credit information on the domestic lumber & forest products industry, a membership with Blue Book Services gives you access to:
- Ratings & Business Reports
- Dynamic Search Tools
- Real-Time Data