Statistics Canada: Building Permits, August 2021
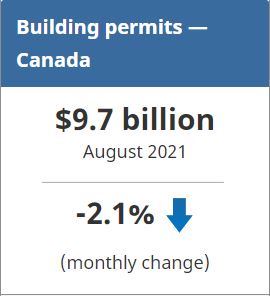
The total value of building permits in Canada decreased 2.1% to $9.7 billion in August. Although most provinces reported increases, notable declines in Ontario and British Columbia pulled the national results lower compared with July.
On a constant dollar basis (2012=100), the total value of building permits fell 1.3%.
Residential permits continue to trend down since March peak
Residential permits decreased 8.3% to $6.4 billion in August, the lowest level since March. Ontario and British Columbia drove most of the decline.
Construction intentions for multi-family units fell 15.9%, largely reflecting Ontario’s decline (-24.3%). This was despite the approval of high value condominium projects in the city of Toronto.
In contrast, single family intentions were up slightly (+1.2%), led by a 15.7% gain in Quebec. Additionally, Newfoundland and Labrador (+0.7%) reported the first provincial increase in this component after six consecutive monthly declines.
Non-residential permits up in August
Non-residential building permits rose 12.3% to $3.3 billion, led by higher construction intentions in Quebec and Alberta.
Commercial building permits were up 14.9% nationally, supported by Ontario’s third consecutive month of growth. A 10-storey office building permit in the city of North York contributed to Ontario’s gains.
The value of institutional building permits rose 21.9% in August. Much of this growth came from Quebec (+78.0%), largely reflecting a $116 million permit for an expansion of a hospital building in the city of Verdun.
Construction intentions for industrial buildings decreased 7.3% to $543 million in August. Nova Scotia reported the largest monthly percentage decrease (-90.9%), following a strong July which included a $40 million utility building permit issued by the city of Halifax.
To explore data using an interactive user interface, visit the Building permits: Interactive Dashboard.
To explore the impact of COVID-19 on the socioeconomic landscape, please consult the Canadian Economic Dashboard and COVID-19.
For more information on housing, please visit the Housing Statistics Portal.
Statistics Canada has a Housing Market Indicators dashboard. This web application provides access to key housing market indicators for Canada, by province and by census metropolitan area. These indicators are updated automatically with new information from monthly releases, giving users access to the latest data.
To read the full report, click here.
Note to readers:
Unless otherwise stated, this release presents seasonally adjusted data with current dollar values, which facilitate month-to-month and quarter-to-quarter comparisons by removing the effects of seasonal variations. For information on seasonal adjustment, see Seasonally adjusted data – Frequently asked questions.
Starting with the March 2021 reference period, monthly constant dollar estimates are available for the entire data series (34-10-0066-01). Constant dollars remove the effects of price changes over time and are calculated using quarterly deflators from the Building Construction Price Index (18-10-0135-01). Typically, the first two months of a quarter use the previous quarter’s price level and are revised when the new quarterly price index becomes available.
Building components
Single-family dwellings: Residential buildings containing only one dwelling unit (e.g., single-detached house, bungalow, linked home [linked at the foundation]).
Multi-family dwellings: Residential buildings containing multiple dwelling units (e.g., apartment, apartment condominium, row house, semi-detached house).
Industrial buildings: Buildings used in the processing or production of goods, or related to transportation and communication.
Commercial buildings: Buildings used in the trade or distribution of goods and services.
Institutional and government buildings: Buildings used to house public and semi-public services, such as those related to health and welfare, education, or public administration, as well as buildings used for religious services.
Revision
Unadjusted data for the current reference month are subject to revision based on late responses. Data for the previous month have been revised. Seasonally adjusted data for the previous two months have also been revised.
Trend-cycle estimates have been added to the charts as a complement to the seasonally adjusted series. Both seasonally adjusted data and trend-cycle estimates are subject to revision as additional observations become available. These revisions could be large and could even lead to a reversal of movement, especially at the end of the series. The higher variability associated with trend-cycle estimates is indicated with a dotted line on the chart.
For information on trend-cycle data, see the StatCan Blog and Trend-cycle estimates – Frequently asked questions.
Next release
Data on building permits for September will be released on November 2, 2021.
Source: Statistics Canada
The Value of Membership

As the leading provider of in-depth business and credit information on the domestic lumber & forest products industry, a membership with Blue Book Services gives you access to:
- Ratings & Business Reports
- Dynamic Search Tools
- Real-Time Data