NAR: Existing-Home Sales Ascend 7.0% in September

Existing-home sales rebounded in September after seeing sales wane the previous month, according to the National Association of Realtors®. Each of the four major U.S. regions witnessed increases on a month-over-month basis. From a year-over-year timeframe, one region held steady while the three others each reported a decline in sales.
Key Highlights
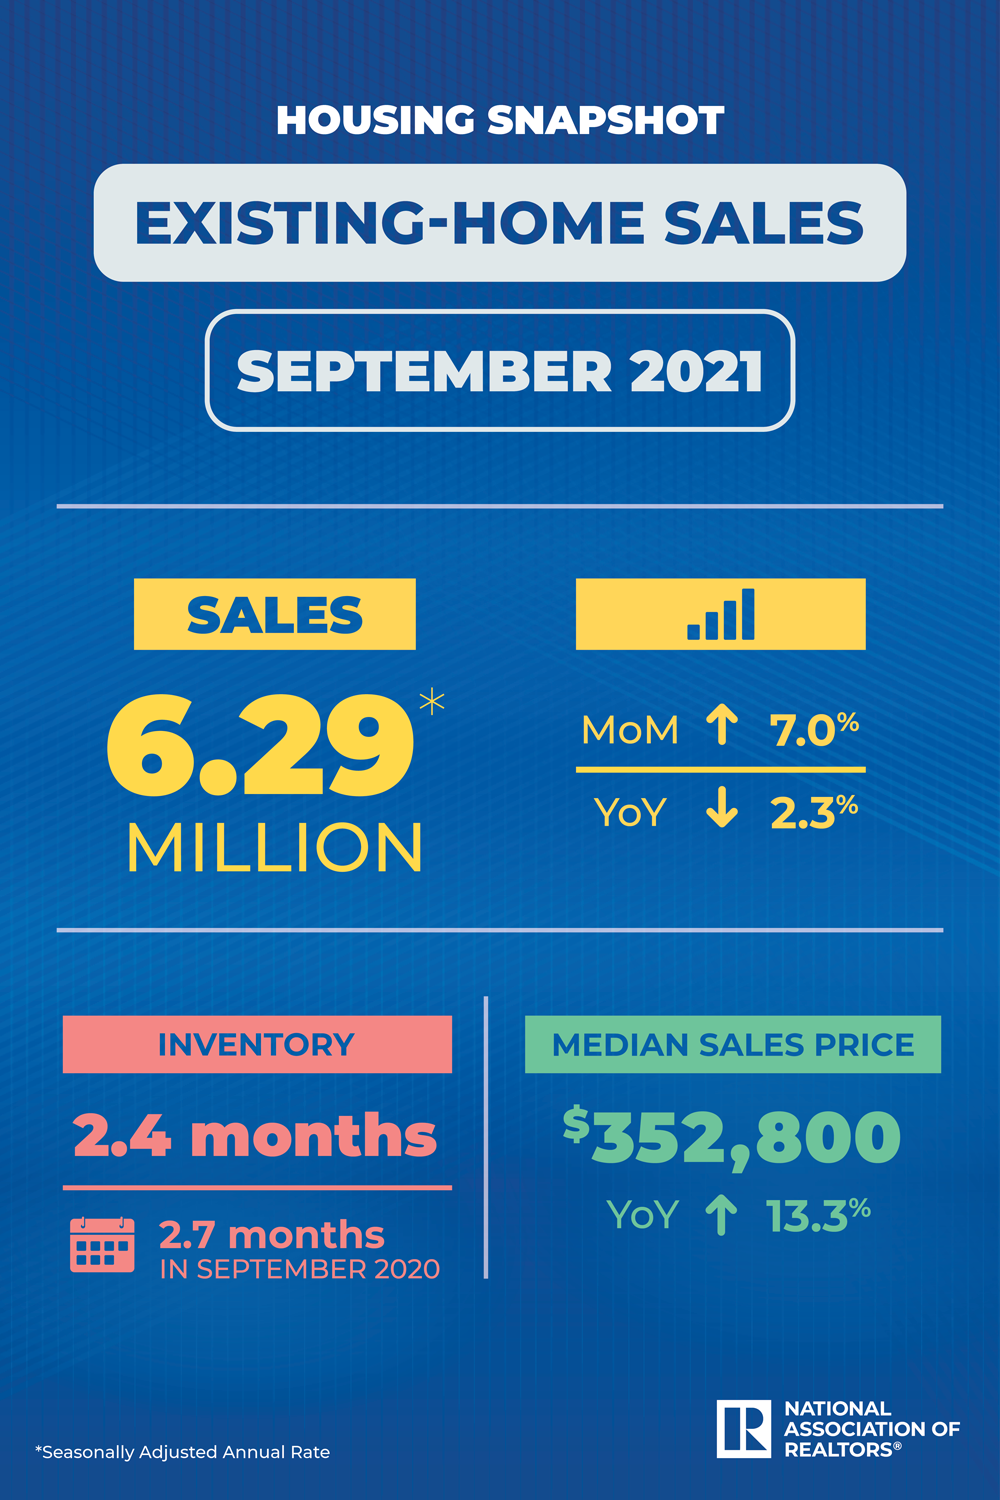
– Existing-home sales on a seasonally adjusted annual rate rose 7% in September from August, with all regions showing an increase.
– From one year ago, the inventory of unsold homes decreased 13% to 1.27 million – equivalent to 2.4 months of the monthly sales pace. From the prior month, inventory dipped 0.8%.
– The median existing-home sales price climbed 13.3% year-over-year to $352,800.
Total existing-home sales,1 https://www.nar.realtor/existing-home-sales, completed transactions that include single-family homes, townhomes, condominiums and co-ops, rose 7.0% from August to a seasonally adjusted annual rate of 6.29 million in September. However, sales decreased 2.3% from a year ago (6.44 million in September 2020).
“Some improvement in supply during prior months helped nudge up sales in September,” said Lawrence Yun, NAR’s chief economist. “Housing demand remains strong as buyers likely want to secure a home before mortgage rates increase even further next year.”
Total housing inventory2 at the end of September amounted to 1.27 million units, down 0.8% from August and down 13.0% from one year ago (1.46 million). Unsold inventory sits at a 2.4-month supply at the present sales pace, down 7.7% from August and down from 2.7 months in September 2020.
The median existing-home price3 for all housing types in September was $352,800, up 13.3% from September 2020 ($311,500), as prices rose in each region. This marks 115 straight months of year-over-year increases.
“As mortgage forbearance programs end, and as homebuilders ramp up production – despite the supply-chain material issues – we are likely to see more homes on the market as soon as 2022,” said Yun.
Properties typically remained on the market for 17 days in September, unchanged from August and down from 21 days in September 2020. Eighty-six percent of homes sold in September 2021 were on the market for less than a month.
First-time buyers accounted for 28% of sales in September, down from 29% in August and 31% in September 2020. NAR’s 2020 Profile of Home Buyers and Sellers – released in late 20204 – revealed that the annual share of first-time buyers was 31%.
“First-time buyers are hit particularly hard by the historically high home prices as they largely do not have the savings required to buy a home or equity to offset such a purchase,” said Yun.
Individual investors or second-home buyers, who account for many cash sales, purchased 13% of homes in September, down from 15% in August but up from 12% in September 2020. All-cash sales accounted for 23% of transactions in September, up from both 22% in August and from 18% in September 2020.
Distressed sales5 – foreclosures and short sales – represented less than 1% of sales in September, equal to the percentage seen a month prior and equal to September 2020.
According to Freddie Mac, the average commitment rate(link is external) for a 30-year, conventional, fixed-rate mortgage was 2.90 in September, up from 2.84% in August. The average commitment rate across all of 2020 was 3.11%.
Single-family and Condo/Co-op Sales
Single-family home sales decreased to a seasonally adjusted annual rate of 5.59 million in September, up 7.7% from 5.19 million in August and down 3.1% from one year ago. The median existing single-family home price was $359,700 in September, up 13.8% from September 2020.
Existing condominium and co-op sales were recorded at a seasonally adjusted annual rate of 700,000 units in September, up 1.4% from 690,000 in August and up 4.5% from one year ago. The median existing condo price was $297,900 in September, an annual increase of 9.3%.
“As housing laws change and new legislation is proposed, NAR remains steadfast in its mission to promote and defend homeownership opportunities for all,” said NAR President Charlie Oppler, a Realtor® from Franklin Lakes, N.J., and the CEO of Prominent Properties Sotheby’s International Realty. “We continually work on behalf of consumers and our members to see inventory increased and ensure homebuyer and homeowner rights are protected.”
Regional Breakdown
Existing-home sales in the Northeast grew 5.5% in September, posting an annual rate of 770,000, an 8.3% decrease from September 2020. The median price in the Northeast was $387,200, up 9.2% from one year ago.
Existing-home sales in the Midwest rose 5.1% to an annual rate of 1,440,000 in September, a 2.7% drop from a year ago. The median price in the Midwest was $265,300, a 9.1% increase from September 2020.
Existing-home sales in the South jumped 8.6% in September, recording an annual rate of 2,770,000, unchanged from one year ago. The median price in the South was $307,500, a 14.8% rise from one year ago.
Existing-home sales in the West climbed 6.5%, registering an annual rate of 1,310,000 in September, down 3.0% from one year ago. The median price in the West was $506,300, up 8.3% from September 2020.
The National Association of Realtors® is America’s largest trade association, representing more than 1.5 million members involved in all aspects of the residential and commercial real estate industries.
# # #
For local information, please contact the local association of Realtors® for data from local multiple listing services (“MLS”). Local MLS data is the most accurate source of sales and price information in specific areas, although there may be differences in reporting methodology.
NOTE: NAR’s Pending Home Sales Index for September is scheduled for release on October 28, and Existing-Home Sales for October will be released November 22; release times are 10:00 a.m. ET.
1) Existing-home sales, which include single-family, townhomes, condominiums and co-ops, are based on transaction closings from Multiple Listing Services. Changes in sales trends outside of MLSs are not captured in the monthly series. NAR rebenchmarks home sales periodically using other sources to assess overall home sales trends, including sales not reported by MLSs. Existing-home sales, based on closings, differ from the U.S. Census Bureau’s series on new single-family home sales, which are based on contracts or the acceptance of a deposit. Because of these differences, it is not uncommon for each series to move in different directions in the same month. In addition, existing-home sales, which account for more than 90% of total home sales, are based on a much larger data sample – about 40% of multiple listing service data each month – and typically are not subject to large prior-month revisions. The annual rate for a particular month represents what the total number of actual sales for a year would be if the relative pace for that month were maintained for 12 consecutive months. Seasonally adjusted annual rates are used in reporting monthly data to factor out seasonal variations in resale activity. For example, home sales volume is normally higher in the summer than in the winter, primarily because of differences in the weather and family buying patterns. However, seasonal factors cannot compensate for abnormal weather patterns. Single-family data collection began monthly in 1968, while condo data collection began quarterly in 1981; the series were combined in 1999 when monthly collection of condo data began. Prior to this period, single-family homes accounted for more than nine out of 10 purchases. Historic comparisons for total home sales prior to 1999 are based on monthly single-family sales, combined with the corresponding quarterly sales rate for condos.
2) Total inventory and month’s supply data are available back through 1999, while single-family inventory and month’s supply are available back to 1982 (prior to 1999, single-family sales accounted for more than 90% of transactions and condos were measured only on a quarterly basis).
3) The median price is where half sold for more and half sold for less; medians are more typical of market conditions than average prices, which are skewed higher by a relatively small share of upper-end transactions. The only valid comparisons for median prices are with the same period a year earlier due to seasonality in buying patterns. Month-to-month comparisons do not compensate for seasonal changes, especially for the timing of family buying patterns. Changes in the composition of sales can distort median price data. Year-ago median and mean prices sometimes are revised in an automated process if additional data is received. The national median condo/co-op price often is higher than the median single-family home price because condos are concentrated in higher-cost housing markets. However, in a given area, single-family homes typically sell for more than condos as seen in NAR’s quarterly metro area price reports.
4) Survey results represent owner-occupants and differ from separately reported monthly findings from NAR’s Realtors® Confidence Index, which include all types of buyers. Investors are under-represented in the annual study because survey questionnaires are mailed to the addresses of the property purchased and generally are not returned by absentee owners. Results include both new and existing homes.
5) Distressed sales (foreclosures and short sales), days on market, first-time buyers, all-cash transactions and investors are from a monthly survey for the NAR’s Realtors® Confidence Index, posted at nar.realtor.
Source: National Association of Realtors
The Value of Membership

As the leading provider of in-depth business and credit information on the domestic lumber & forest products industry, a membership with Blue Book Services gives you access to:
- Ratings & Business Reports
- Dynamic Search Tools
- Real-Time Data