Statistics Canada: Building Permits, September 2021
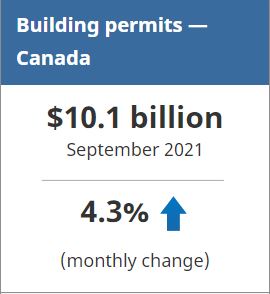
The total value of building permits rose 4.3% to $10.1 billion in September, led by Ontario (+6.3%). Construction intentions in the residential sector were up 8.2%, while the non-residential sector decreased 3.2%.
On a constant dollar basis (2012=100), building permits increased 3.4% to $6.9 billion.
Ontario drives residential permits up
High-value permits for two new condo buildings valued at over $300 million in the cities of Mississauga and Toronto helped push Ontario’s multi-family permits up 40.4% to $1.7 billion in September. At the national level, multi-family permits rose sharply, up 18.6% to $3.9 billion.
Conversely, construction intentions for single-family homes declined 2.7% to $3.0 billion, mainly reflecting decreases in Ontario and Quebec.
Overall, the residential sector rose 8.2% in September to $6.9 billion.
Non-residential permit values down
Construction intentions for the non-residential sector were down 3.2% to $3.3 billion in September, despite climbing 55.0% in Alberta.
The value of institutional building permits dropped 30.6%, mostly due to a 35.3% decline in Quebec. The decrease in Quebec followed a strong August when a $116 million permit was issued for a hospital expansion in the city of Verdun.
Commercial building permits fell 12.4% to $1.6 billion in September, mostly due to declines in Ontario.
Industrial building permits jumped 72.1% to $987 million, a record high for the series. Alberta’s growth of 382.9% led the way, reflecting a permit valued at $400 million for the expansion of Calgary International Airport’s Airside Maintenance Centre.
Third quarter construction intentions continue to ease
The total value of building permits saw a second quarterly decline, down 3.8% to $29.8 billion in the third quarter compared with the previous quarter. However, building permits were 14.3% higher compared with the third quarter of 2020.
The value of residential building permits fell 5.4% to $20.2 billion in the third quarter of 2021, with declines in both single-family and multi-family dwellings. In contrast, on a year-over-year basis, the residential sector was up 16.5%.
Construction intentions for the non-residential sector edged down 0.2% to $9.6 billion compared with the second quarter. Industrial building permits rose 33.8%, helped by large projects such as the Calgary International Airport’s Airside Maintenance Centre expansion and a wind turbine blade manufacturing plant in Quebec. However, declines in the commercial (-3.2%) and institutional (-14.4%) components pulled the sector down overall for the quarter.
On a constant dollar basis (2012=100), building permits fell 6.6% to $20.4 billion in the third quarter, and were down 3.1% compared with the same period a year earlier. The year-over-year decrease in constant dollar terms mainly reflects higher construction prices in 2021.
To explore data using an interactive user interface, visit the Building permits: Interactive Dashboard.
To explore the impact of COVID-19 on the socioeconomic landscape, please consult the Canadian Economic Dashboard and COVID-19.
For more information on housing, please visit the Housing Statistics Portal.
Statistics Canada has a Housing Market Indicators dashboard. This web application provides access to key housing market indicators for Canada, by province and by census metropolitan area. These indicators are updated automatically with new information from monthly releases, giving users access to the latest data.
Note to Readers
Unless otherwise stated, this release presents seasonally adjusted data with current dollar values, which facilitate month-to-month and quarter-to-quarter comparisons by removing the effects of seasonal variations. For information on seasonal adjustment, see Seasonally adjusted data – Frequently asked questions.
Starting with the March 2021 reference period, monthly constant dollar estimates are available for the entire data series (34-10-0066-01). Constant dollars remove the effects of price changes over time and are calculated using quarterly deflators from the Building Construction Price Index (18-10-0135-01). Typically, the first two months of a quarter use the previous quarter’s price level and are revised when the new quarterly price index becomes available.
Building Components
Single-family dwellings: Residential buildings containing only one dwelling unit (e.g., single-detached house, bungalow, linked home [linked at the foundation]).
Multi-family dwellings: Residential buildings containing multiple dwelling units (e.g., apartment, apartment condominium, row house, semi-detached house).
Industrial buildings: Buildings used in the processing or production of goods, or related to transportation and communication.
Commercial buildings: Buildings used in the trade or distribution of goods and services.
Institutional and government buildings: Buildings used to house public and semi-public services, such as those related to health and welfare, education, or public administration, as well as buildings used for religious services.
Revision
Unadjusted data for the current reference month are subject to revision based on late responses. Data for the previous month have been revised. Seasonally adjusted data for the previous two months have also been revised.
Trend-cycle estimates have been added to the charts as a complement to the seasonally adjusted series. Both seasonally adjusted data and trend-cycle estimates are subject to revision as additional observations become available. These revisions could be large and could even lead to a reversal of movement, especially at the end of the series. The higher variability associated with trend-cycle estimates is indicated with a dotted line on the charts.
For information on trend-cycle data, see the StatCan Blog and Trend-cycle estimates – Frequently asked questions.
Next Release
Data on building permits for October will be released on December 1, 2021.
Source: Statistics Canada
The Value of Membership

As the leading provider of in-depth business and credit information on the domestic lumber & forest products industry, a membership with Blue Book Services gives you access to:
- Ratings & Business Reports
- Dynamic Search Tools
- Real-Time Data