Statistics Canada: Building Permits, October 2021
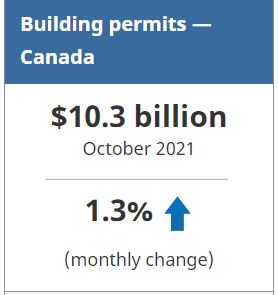
The total value of building permits increased 1.3% to $10.3 billion in October, led by gains in British Columbia (+15.0%) and Ontario (+4.5%). Construction intentions in the non-residential sector were up 4.2%, while the residential sector edged down 0.1%.
On a constant dollar basis (2012=100), building permits increased 0.7% to $7.0 billion.
New Brunswick Sees Big Jump in Residential Sector
Residential construction intentions edged down 0.1% to $6.9 billion, with Ontario (-2.2%) and British Columbia (-4.9%) pulling down the sector.
Multi-family units fell 8.8% at the national level, following a strong September, mostly due to fewer higher valued permits issued in Ontario and British Columbia.
Conversely, New Brunswick (+123.8%) reported its second highest value on record, stemming from high value apartment permits in the cities of Saint John, Moncton and Shediac.
The value of permits for single-family homes rose 10.8% in October, led by Ontario (+15.1%). Saskatchewan was the only province to report a decline (-8.6%).
Non-Residential Sector Recovery Continues
Construction intentions for institutional buildings jumped 63.2%, with a $254 million Mills Memorial hospital project in Terrace, British Columbia helping construction intentions for the province to increase substantially (+528.9%) compared with the previous month.
Commercial building permits rose 10.1% for the month, with Ontario leading the way (+36.8%) with notable projects in Toronto such as the office renovation for the SickKids foundation.
September’s strong growth in industrial building permits, which largely reflected the Calgary International Airport’s Airside Maintenance expansion project, returned to more normal levels in October.
Overall, the total value of building permits in the non-residential sector at the national level rose 4.2% to $3.4 billion, 16.7% above the pre-pandemic level in February 2020.
To explore data using an interactive user interface, visit the Building permits: Interactive Dashboard.
To explore the impact of COVID-19 on the socioeconomic landscape, please consult the Canadian Economic Dashboard and COVID-19.
For more information on housing, please visit the Housing Statistics portal.
Statistics Canada has a Housing Market Indicators dashboard. This web application provides access to key housing market indicators for Canada, by province and by census metropolitan area. These indicators are updated automatically with new information from monthly releases, giving users access to the latest data.
Note to Readers
Unless otherwise stated, this release presents seasonally adjusted data with current dollar values, which facilitate month-to-month and quarter-to-quarter comparisons by removing the effects of seasonal variations. For information on seasonal adjustment, see Seasonally adjusted data – Frequently asked questions.
Starting with the March 2021 reference period, monthly constant dollar estimates are available for the entire data series (34-10-0066-01). Constant dollars remove the effects of price changes over time and are calculated using quarterly deflators from the Building Construction Price Index (18-10-0135-01). Typically, the first two months of a quarter use the previous quarter’s price level and are revised when the new quarterly price index becomes available.
Building Components
Single-family dwellings: Residential buildings containing only one dwelling unit (e.g., single-detached house, bungalow, linked home [linked at the foundation]).
Multi-family dwellings: Residential buildings containing multiple dwelling units (e.g., apartment, apartment condominium, row house, semi-detached house).
Industrial buildings: Buildings used in the processing or production of goods, or related to transportation and communication.
Commercial buildings: Buildings used in the trade or distribution of goods and services.
Institutional and government buildings: Buildings used to house public and semi-public services, such as those related to health and welfare, education, or public administration, as well as buildings used for religious services.
Revision
Unadjusted data for the current reference month are subject to revision based on late responses. Data for the previous month have been revised. Seasonally adjusted data for the previous two months have also been revised.
Trend-cycle estimates have been added to the charts as a complement to the seasonally adjusted series. Both seasonally adjusted data and trend-cycle estimates are subject to revision as additional observations become available. These revisions could be large and could even lead to a reversal of movement, especially at the end of the series. The higher variability associated with trend-cycle estimates is indicated with a dotted line on the charts.
For information on trend-cycle data, see the StatCan Blog and Trend-cycle estimates – Frequently asked questions.
Next Release
Data on building permits for November 2021 will be released on January 5, 2022.
Source: Statistics Canada
The Value of Membership

As the leading provider of in-depth business and credit information on the domestic lumber & forest products industry, a membership with Blue Book Services gives you access to:
- Ratings & Business Reports
- Dynamic Search Tools
- Real-Time Data