Statistics Canada: Investment in Building Construction, February 2022
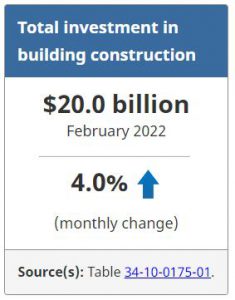
Investment in building construction increased 4.0% in February, reaching $20.0 billion for the first time. Most provinces reported gains, with Quebec accounting for over 50% of the increase.
On a constant dollar basis (2012=100), investment in building construction increased 3.9% to $12.7 billion.
Residential construction continues to show strength
Investment in single family homes rose 4.9% to $8.0 billion in February. Increases were posted in seven provinces, led by Ontario (+5.3%) and Quebec (+8.2%).
Multi-unit construction increased 5.1% to $6.9 billion, driven primarily by strong gains in Quebec (+16.8%). Conversely, Saskatchewan declined for a third straight month as it returned to more historic levels, following higher investment in October and November 2021.
Overall, residential construction investment rose 5.0% to $14.9 billion in February.
Non-residential sector increases for eighth straight month
Non-residential construction investment increased 1.1% to $5.1 billion in February.
Commercial investment was up 1.0% to $2.8 billion, with Alberta leading the way (+3.2%). The only two provinces that posted declines in this component were New Brunswick and Manitoba.
Investment in the institutional component was largely unchanged in February (+0.1%). Similar to the previous month, gains in Quebec (+1.9%) largely offset losses posted in seven other provinces.
Industrial construction investment rose 2.8% to $893 million, with Ontario (+3.3%) and Quebec (+4.5%) accounting for over 90% of the national gain. This was largely due to several new manufacturing and maintenance building projects in both provinces, while other provinces remained at more historic levels.
For more information on housing, please visit the Housing statistics portal.
For the full release, click here.
Note to readers
Unadjusted data for the current reference month are subject to revision based on late responses. Data for the previous month have been revised. Seasonally adjusted data for the previous three months have also been revised.
Data presented in this release are seasonally adjusted with current dollar values unless otherwise stated. Using seasonally adjusted data allows month-to-month and quarter-to-quarter comparisons by removing the effects of seasonal variations. For information on seasonal adjustment, see Seasonally adjusted data – Frequently asked questions.
Monthly estimates in constant dollars are calculated using quarterly deflators from the Building Construction Price Index (table 18-10-0135-01). Typically, the first two months of a quarter use the previous quarter’s price level, and the data are revised when the new quarterly price index becomes available.
Detailed data on investment activity by type of building and type of work are now available in the unadjusted current dollar series.
Next release
Data on investment in building construction for March will be released on May 17.
Products
Statistics Canada has a “Housing Market Indicators” dashboard. This web application provides access to key housing market indicators for Canada, by province and by census metropolitan area. These indicators are automatically updated with new information from monthly releases, giving users access to the latest data.
Source: Statistics Canada
The Value of Membership

As the leading provider of in-depth business and credit information on the domestic lumber & forest products industry, a membership with Blue Book Services gives you access to:
- Ratings & Business Reports
- Dynamic Search Tools
- Real-Time Data