U.S. Annual Home Price Growth Exceeds 20% in March, CoreLogic Reports

CoreLogic, a leading global property information, analytics and data-enabled solutions provider, today released the CoreLogic Home Price Index (“HPI”™) and HPI Forecast™ for March 2022.
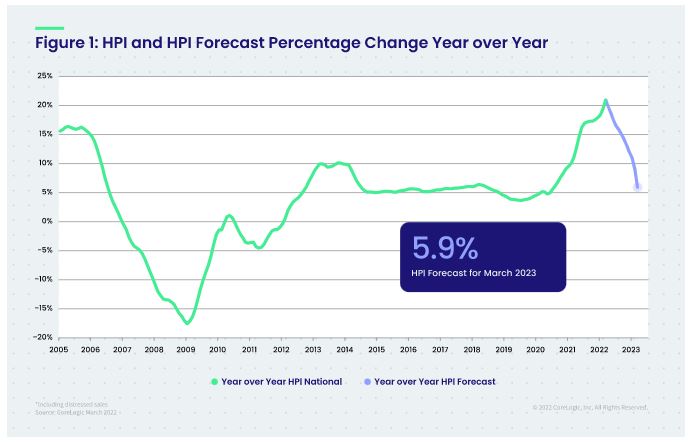
U.S. home prices continued to post significant year-over-year gains in March, up by 20.9%, another record high. Even with the past year’s streak of double-digit price increases, annual gains are projected to slow to around 6% by next March, due in part to rising mortgage rates and higher home prices hampering affordability for some home shoppers. Buyers who closed on a property in March had a good chance of locking in mortgage rates around 4% or slightly lower. By late April, rates had moved up to more than 5%, a jump of about 30% from the same time last year and a trend that might derail more prospective buyers.
“The annual growth in the U.S. index was the largest we have measured in the 45-year history of the CoreLogic Home Price Index,” said Dr. Frank Nothaft, chief economist at CoreLogic. “Couple that price increase with the rapid rise in mortgage rates and buyer affordability has fallen sharply. In April, 30-year fixed mortgage rates averaged nearly 2 percentage points higher than one year earlier. With the growth in home prices, that means the monthly principal and interest payment to buy the median-priced home was up about 50% in April compared with last April.”
Top Takeaways:
- Nationally, home prices increased 20.9% in March 2022, compared to March 2021. On a month-over-month basis, home prices increased by 3.3% compared to February 2022.
- In March, annual appreciation of detached properties (22%) was 4.7 percentage points higher than that of attached properties (17.3%).
- Annual home price gains are forecast to slow to 5.9% by March 2023.
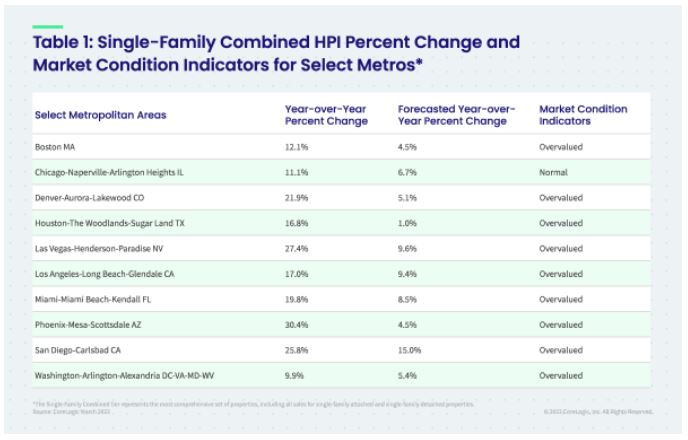
- In March, Tampa, Florida, logged the highest year-over-year home price increase of the country’s 20 largest metro areas at 32.5%. Phoenix ranked second with a 30.4% year-over-year gain. On the lower end of the price growth spectrum were the New York and Washington metro areas, both at 9.9%.
- Mirroring metro level trends, Florida and Arizona were the states with the highest home price gains, a respective 31.4% and 28.7%. Tennessee edged out Nevada for third place with a 26.7% increase in home price growth.
The next CoreLogic HPI press release, featuring April 2022 data, will be issued on June 7, 2022, at 8 a.m. ET.
Methodology
The CoreLogic HPI™ is built on industry-leading public record, servicing and securities real-estate databases and incorporates more than 45 years of repeat-sales transactions for analyzing home price trends. Generally released on the first Tuesday of each month with an average five-week lag, the CoreLogic HPI is designed to provide an early indication of home price trends by market segment and for the “Single-Family Combined” tier, representing the most comprehensive set of properties, including all sales for single-family attached and single-family detached properties. The indices are fully revised with each release and employ techniques to signal turning points sooner. The CoreLogic HPI provides measures for multiple market segments, referred to as tiers, based on property type, price, time between sales, loan type (conforming vs. non-conforming) and distressed sales. Broad national coverage is available from the national level down to ZIP Code, including non-disclosure states. CoreLogic HPI Forecasts™ are based on a two-stage, error-correction econometric model that combines the equilibrium home price—as a function of real disposable income per capita—with short-run fluctuations caused by market momentum, mean-reversion, and exogenous economic shocks like changes in the unemployment rate. With a 30-year forecast horizon, CoreLogic HPI Forecasts project CoreLogic HPI levels for two tiers — “Single-Family Combined” (both attached and detached) and “Single-Family Combined Excluding Distressed Sales.” As a companion to the CoreLogic HPI Forecasts, Stress-Testing Scenarios align with Comprehensive Capital Analysis and Review (CCAR) national scenarios to project five years of home prices under baseline, adverse and severely adverse scenarios at state, metropolitan areas and ZIP Code levels. The forecast accuracy represents a 95% statistical confidence interval with a +/- 2% margin of error for the index.
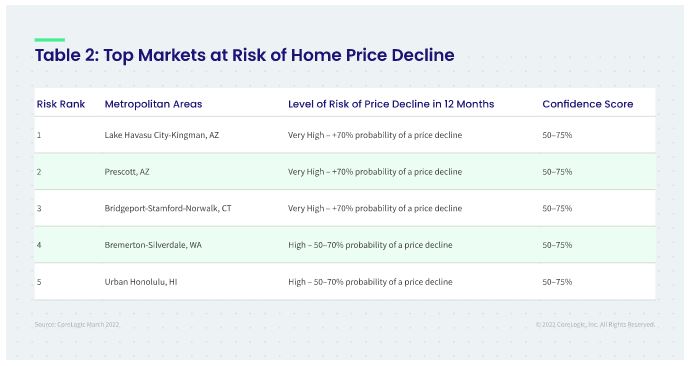
About Market Risk Indicators
Market Risk Indicators are a subscription-based analytics solution that provide monthly updates on the overall “health” of housing markets across the country. CoreLogic data scientists combine world-class analytics with detailed economic and housing data to help determine the likelihood of a housing bubble burst in 392 major metros and all 50 states. Market Risk Indicators is a multi-phase regression model that provides a probability score (from 1 to 100) on the likelihood of two scenarios per metro: a >10% price reduction and a = 10% price reduction. The higher the score, the higher the risk of a price reduction.
About the Market Condition Indicators
As part of the CoreLogic HPI and HPI Forecasts offerings, Market Condition Indicators are available for all metropolitan areas and identify individual markets as “overvalued”, “at value”, or “undervalued.” These indicators are derived from the long-term fundamental values, which are a function of real disposable income per capita. Markets are labeled as overvalued if the current home price indexes exceed their long-term values by greater than 10%, and undervalued where the long-term values exceed the index levels by greater than 10%.
Source: CoreLogic, Inc.
The Value of Membership

As the leading provider of in-depth business and credit information on the domestic lumber & forest products industry, a membership with Blue Book Services gives you access to:
- Ratings & Business Reports
- Dynamic Search Tools
- Real-Time Data