NAR: Pending Home Sales Dropped 2.0% in August

Pending home sales sagged for the third straight month in August, according to the National Association of REALTORS®. Three out of four major regions experienced month-over-month decreases in transactions, however, the West saw a modest gain. Year-over-year, all four regions posted double-digit declines.
Key Highlights
- Pending home sales waned for the third consecutive month, down 2.0% from July.
- For the second month in a row, pending sales retreated in the Northeast, Midwest and South, while the West, again, registered a small increase.
- Compared to the previous year, contract signings retracted by double-digit percentages in each region.
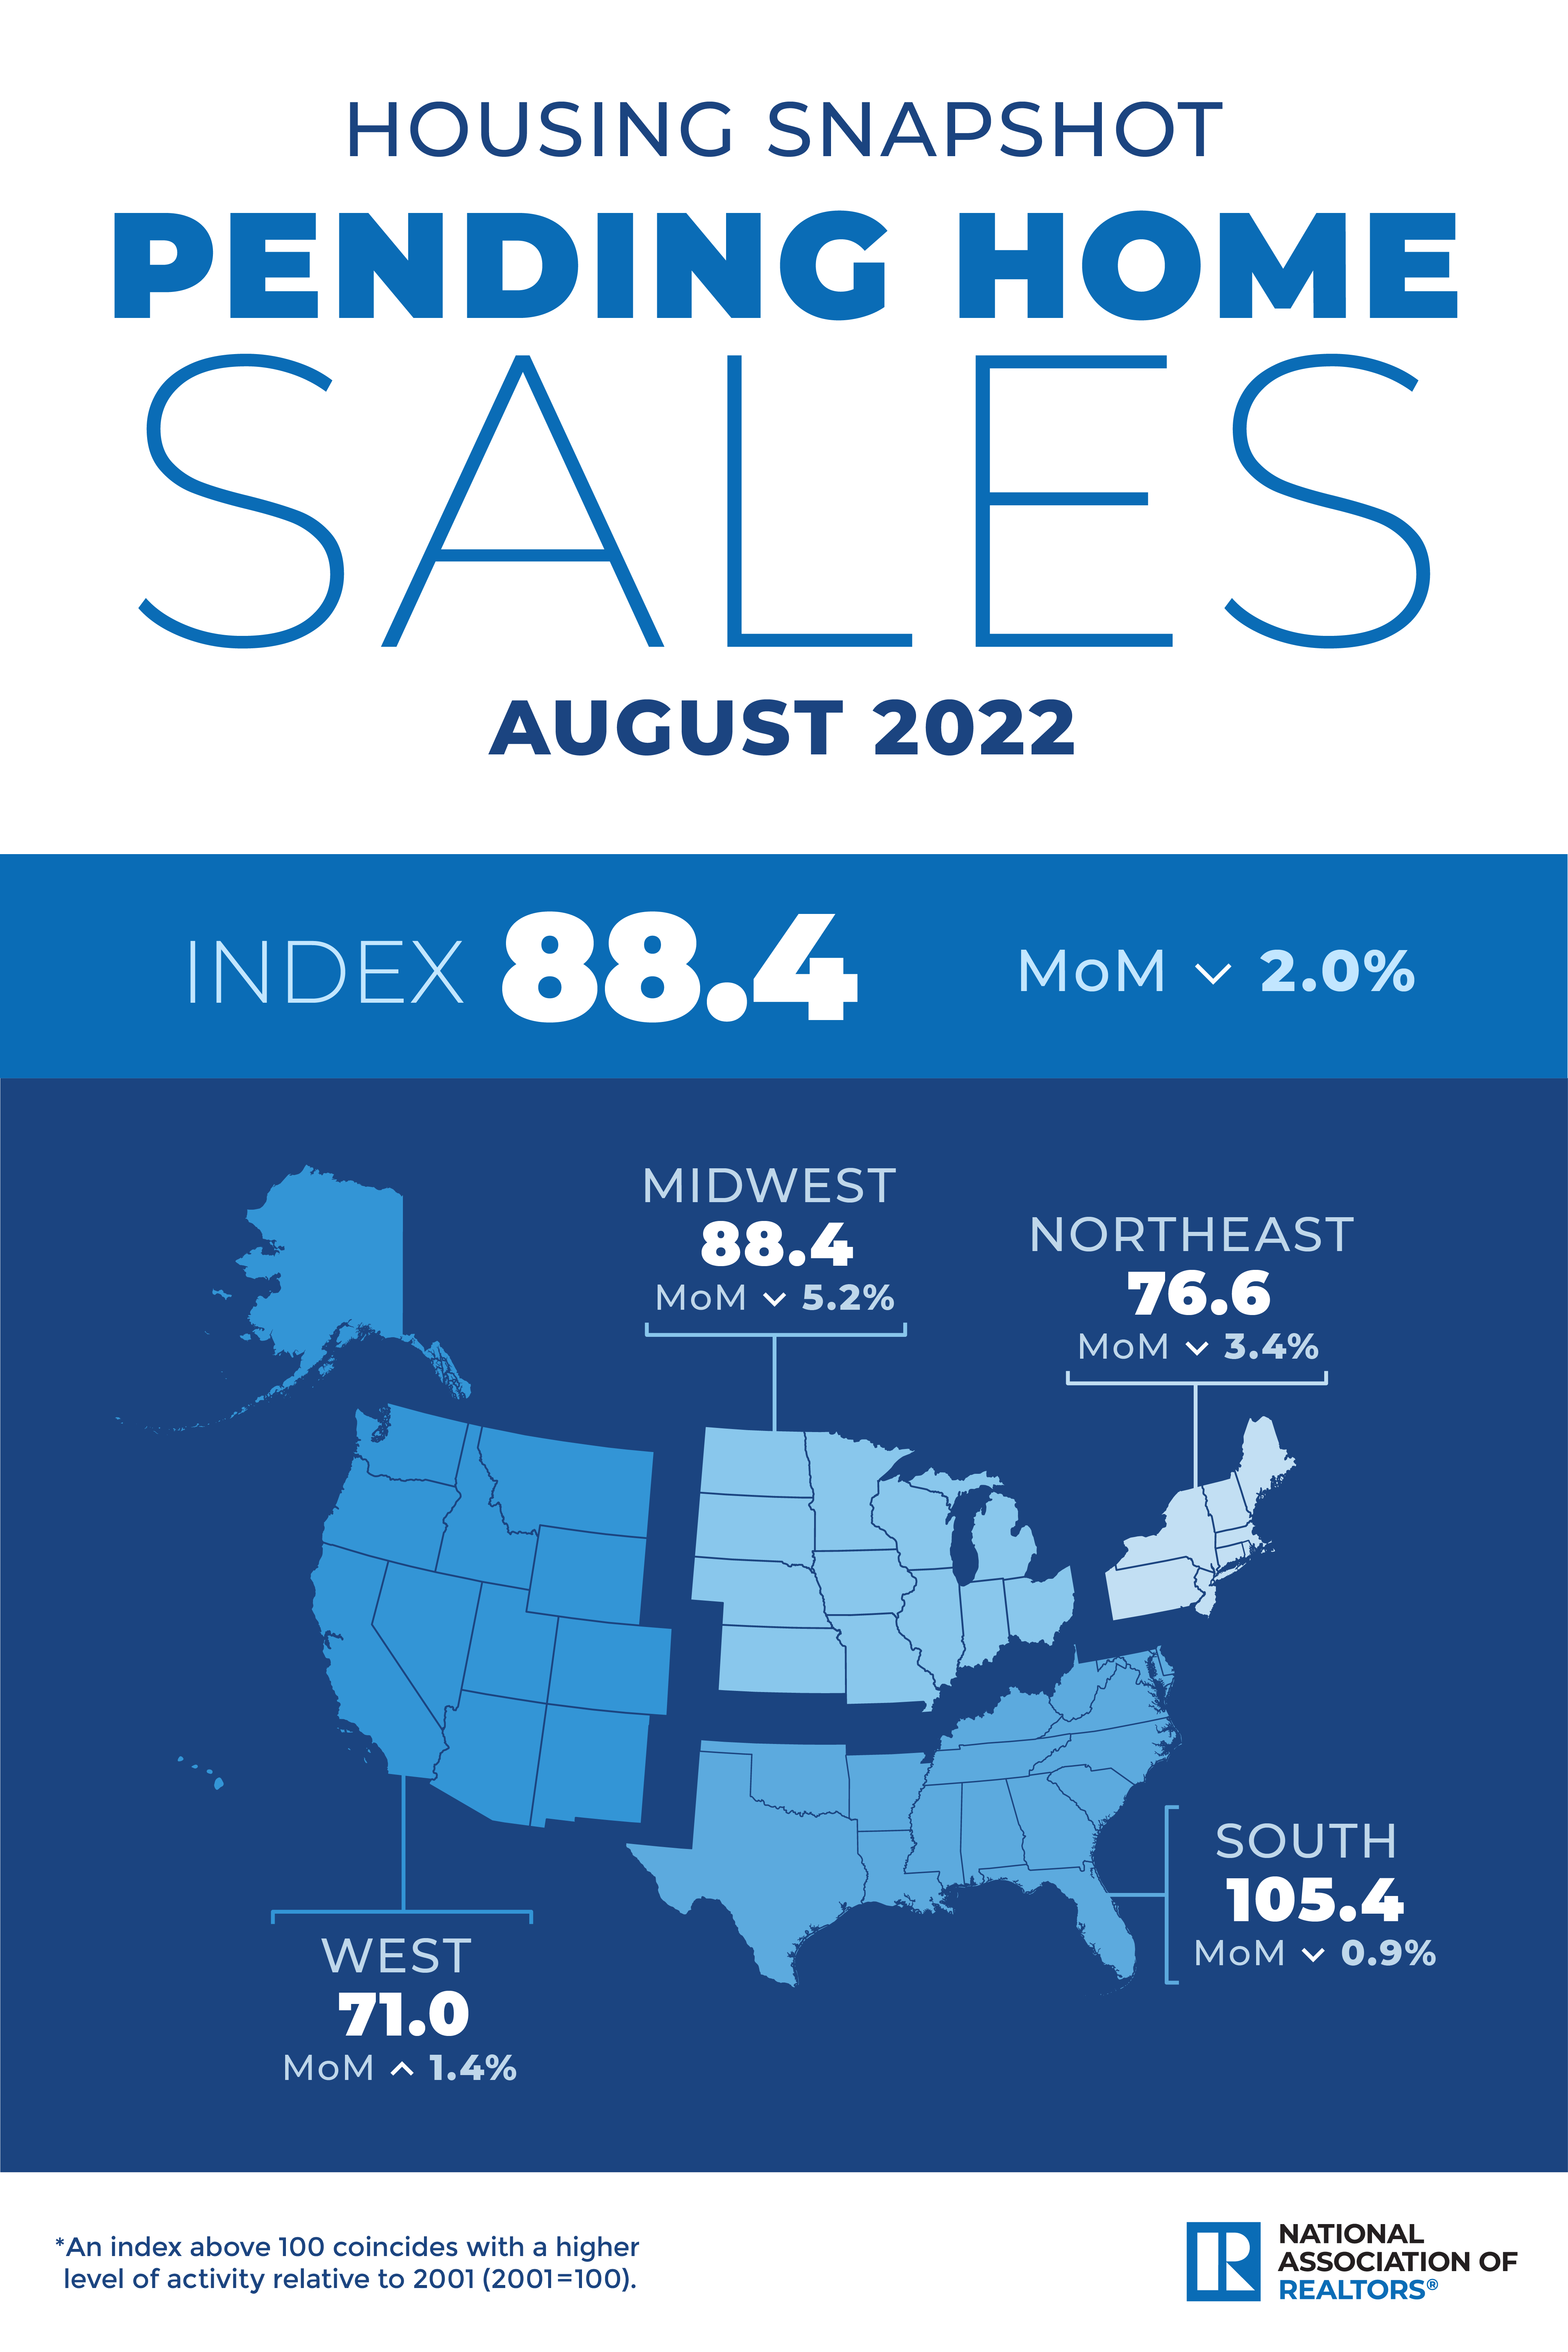
The Pending Home Sales Index (“PHSI”),* www.nar.realtor/pending-home-sales, a forward-looking indicator of home sales based on contract signings, fell 2.0% to 88.4 in August. Year-over-year, pending transactions dwindled by 24.2%. An index of 100 is equal to the level of contract activity in 2001.
“The direction of mortgage rates – upward or downward – is the prime mover for home buying, and decade-high rates have deeply cut into contract signings,” said NAR Chief Economist Lawrence Yun. “If mortgage rates moderate and the economy continues adding jobs, then home buying should also stabilize.”
Yun expects the economy will remain sluggish throughout the remainder of this year, with mortgage rates rising to close to 7% in the coming months.
“Only when inflation calms down will we see mortgage rates begin to steady,” said Yun.
As a result of the current interest rate environment and weaker economic activity, NAR expects existing-home sales to decline 15.2% in 2022, to 5.19 million units, while new home sales are projected to fall by 20.9%.
Yun notes that limited housing inventory and almost non-existent distressed property sales have supported home prices. Overall, he forecasts prices will rise by 9.6% in 2022.
In 2023, Yun foresees slower price appreciation and corresponding increases in sales as the year progresses.
“Next year, the annual median home price is expected to rise by only 1.2%,” Yun added. “Home sales will pick up in the second half of 2023, but will be down by 7.1% overall.”
Pending Home Sales Regional Breakdown
The Northeast PHSI decreased 3.4% from last month to 76.6, down 19.0% from August 2021. The Midwest index fell 5.2% to 88.4 in August, a 21.1% drop from the previous year.
The South PHSI slid 0.9% to 105.4 in August, a decline of 24.2% from a year ago. The West index rose by 1.4% in August to 71.0, down 31.3% from August 2021.
“Home prices are the least affordable in the West and, consequently, the region suffered deeper annual declines in contract signings due to rising interest rates when compared to other areas of the country,” Yun added. “However, the recent increases of the last two months, though small, are encouraging.”
The National Association of REALTORS® is America’s largest trade association, representing more than 1.5 million members involved in all aspects of the residential and commercial real estate industries.
# # #
*The Pending Home Sales Index is a leading indicator for the housing sector, based on pending sales of existing homes. A sale is listed as pending when the contract has been signed but the transaction has not closed, though the sale usually is finalized within one or two months of signing. Pending contracts are good early indicators of upcoming sales closings. However, the amount of time between pending contracts and completed sales is not identical for all home sales. Variations in the length of the process from pending contract to closed sale can be caused by issues such as buyer difficulties with obtaining mortgage financing, home inspection problems, or appraisal issues. The index is based on a sample that covers about 40% of multiple listing service data each month. In developing the model for the index, it was demonstrated that the level of monthly sales-contract activity parallels the level of closed existing-home sales in the following two months. An index of 100 is equal to the average level of contract activity during 2001, which was the first year to be examined. By coincidence, the volume of existing-home sales in 2001 fell within the range of 5.0 to 5.5 million, which is considered normal for the current U.S. population.
NOTE: Existing-Home Sales for September will be reported on October 20. The next Pending Home Sales Index will be on October 28. All release times are 10 a.m. Eastern.
Source: National Association of Realtors
The Value of Membership

As the leading provider of in-depth business and credit information on the domestic lumber & forest products industry, a membership with Blue Book Services gives you access to:
- Ratings & Business Reports
- Dynamic Search Tools
- Real-Time Data