U.S. Census Bureau: Monthly New Residential Construction, November 2022

Notice of methodology change: Beginning with the January New Residential Construction release on February 16, 2023, the Building Permits survey will change its target universe from the current 2014 basis to an annually updated universe. This change will allow for more accurate and quicker coverage when jurisdictions change from not issuing building permits to issuing them. For additional details on this change and the impact on New Residential Construction, see our 2023 Methodology Change FAQs.
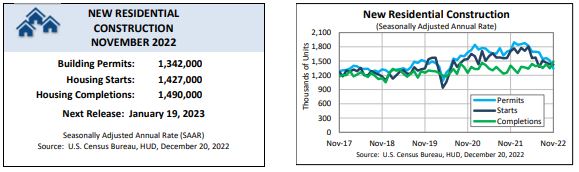
The U.S. Census Bureau and the U.S. Department of Housing and Urban Development jointly announced the following new residential construction statistics for November 2022:
Building Permits
Privately-owned housing units authorized by building permits in November were at a seasonally adjusted annual rate of 1,342,000. This is 11.2 percent below the revised October rate of 1,512,000 and is 22.4 percent below the November 2021 rate of 1,729,000. Single-family authorizations in November were at a rate of 781,000; this is 7.1 percent below the revised October figure of 841,000. Authorizations of units in buildings with five units or more were at a rate of 509,000 in November.
Housing Starts
Privately-owned housing starts in November were at a seasonally adjusted annual rate of 1,427,000. This is 0.5 percent (±12.3 percent)* below the revised October estimate of 1,434,000 and is 16.4 percent (±13.4 percent) below the November 2021 rate of 1,706,000. Single-family housing starts in November were at a rate of 828,000; this is 4.1 percent (±11.3 percent)* below the revised October figure of 863,000. The November rate for units in buildings with five units or more was 584,000.
Housing Completions
Privately-owned housing completions in November were at a seasonally adjusted annual rate of 1,490,000. This is 10.8 percent (±15.8 percent)* above the revised October estimate of 1,345,000 and is 6.0 percent (±17.6 percent)* above the November 2021 rate of 1,406,000. Single-family housing completions in November were at a rate of 1,047,000; this is 9.5 percent (±12.9 percent)* above the revised October rate of 956,000. The November rate for units in buildings with five units or more was 430,000.
The December report is scheduled for release on January 19, 2023. View the full schedule in the Economic Briefing Room: www.census.gov/economic-indicators . The full text and tables for this release can be found at www.census.gov/construction/nrc/ .
The original report can be read here.
Source: U.S. Census Bureau
The Value of Membership

As the leading provider of in-depth business and credit information on the domestic lumber & forest products industry, a membership with Blue Book Services gives you access to:
- Ratings & Business Reports
- Dynamic Search Tools
- Real-Time Data