CoreLogic: US Annual Home Price Growth Continues Single-Digit Slide in February

CoreLogic®, a leading global property information, analytics and data-enabled solutions provider, today released the CoreLogic Home Price Index (HPI™) and HPI Forecast™ for February 2023.
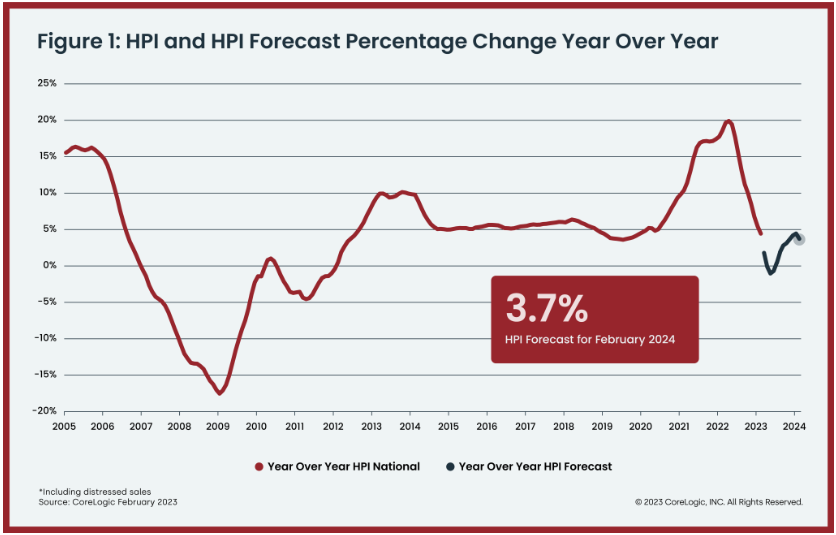
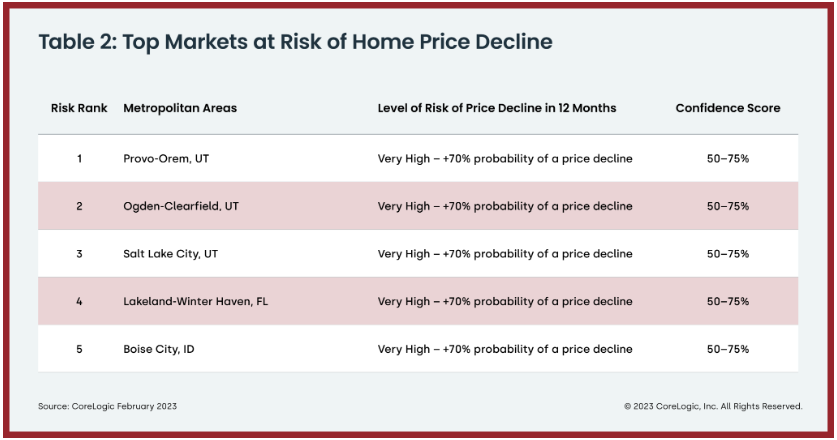
While annual U.S home price growth rose for the 133rd straight month in February, the 4.4% increase was the lowest recorded since 2019. Eight states and districts recorded annual home price losses, with much of the depreciation seen in the relatively expensive Western U.S., including California, Idaho, Oregon, Washington and Utah.
Tech company layoffs have likely affected housing demand on the West Coast, However, as noted in the latest CoreLogic S&P Case-Shiller Index, home prices gains are holding steady in some large East Coast metros, as workers return to offices and buyer demand renews in areas that saw relatively less appreciation during the pandemic. Areas in the Southern U.S. are also holding up well given current market conditions.
“The divergence in home price changes across the U.S. reflects a tale of two housing markets,” said Selma Hepp, chief economist at CoreLogic. “Declines in the West are due to the tech industry slowdown and a severe lack of affordability after decades of undersupply. The consistent gains in the Southeast and South reflect strong job markets, in-migration patterns and relative affordability due to new home construction.”
“But while housing market challenges remain, particularly in light of mortgage rate volatility and the ongoing banking turmoil,” Hepp continued, “pent-up homebuyer demand is responding favorably to lower rates in many markets. This trend holds true even in the West, leading to a solid monthly gain in home prices in February. U.S. home prices rose by 0.8% in February, double the month-over-month increase historically seen and indicating that prices in most markets have already bottomed out.”
Top Takeaways:
- U.S. home prices (including distressed sales) increased by 4.4% year over year in February 2023 compared to February 2022. On a month-over-month basis, home prices increased by 0.8% compared with January 2023.
- In February, the annual appreciation of attached properties (5.4%) was 1.4 percentage points higher than that of detached properties (4%).
- CoreLogic forecasts show annual U.S. home price gains slowing to 3.7% by February 2024.
- Miami posted the highest year-over-year home price increase of the country’s 20 tracked metro areas in February, at 15.6%, while Tampa, Florida continued to rank second at 9.3%.
- Florida and Maine recorded the highest annual home price gains, 11.3% and 10.3%, respectively. South Carolina posted the third-highest growth, with a 9.2% year-over-year increase. Eight states and districts recorded annual losses: Washington (-4.9%), Montana (-3.1%), Nevada (-1.7%), Idaho (-1.6%), Utah (-1.6%), California (-1.5%), Washington, D.C. (-1.2%) and Oregon (-0.7%),
The next CoreLogic HPI press release, featuring March 2023 data, will be issued on May 2, 2023 at 8 a.m. EST.
Methodology
The CoreLogic HPI™ is built on industry-leading public record, servicing and securities real-estate databases and incorporates more than 45 years of repeat-sales transactions for analyzing home price trends. Generally released on the first Tuesday of each month with an average five-week lag, the CoreLogic HPI is designed to provide an early indication of home price trends by market segment and for the Single-Family Combined tier, representing the most comprehensive set of properties, including all sales for single-family attached and single-family detached properties. The indices are fully revised with each release and employ techniques to signal turning points sooner. The CoreLogic HPI provides measures for multiple market segments, referred to as tiers, based on property type, price, time between sales, loan type (conforming vs. non-conforming) and distressed sales. Broad national coverage is available from the national level down to ZIP Code, including non-disclosure states.
CoreLogic HPI Forecasts™ are based on a two-stage, error-correction econometric model that combines the equilibrium home price—as a function of real disposable income per capita—with short-run fluctuations caused by market momentum, mean-reversion, and exogenous economic shocks like changes in the unemployment rate. With a 30-year forecast horizon, CoreLogic HPI Forecasts project CoreLogic HPI levels for two tiers — Single-Family Combined (both attached and detached) and Single-Family Combined Excluding Distressed Sales. As a companion to the CoreLogic HPI Forecasts, Stress-Testing Scenarios align with Comprehensive Capital Analysis and Review (CCAR) national scenarios to project five years of home prices under baseline, adverse and severely adverse scenarios at state, metropolitan areas and ZIP Code levels. The forecast accuracy represents a 95% statistical confidence interval with a +/- 2% margin of error for the index.
About Market Risk Indicators
Market Risk Indicators are a subscription-based analytics solution that provide monthly updates on the overall health of housing markets across the country. CoreLogic data scientists combine world-class analytics with detailed economic and housing data to help determine the likelihood of a housing bubble burst in 392 major metros and all 50 states. Market Risk Indicators is a multi-phase regression model that provides a probability score (from 1 to 100) on the likelihood of two scenarios per metro: a >10% price reduction and a = 10% price reduction. The higher the score, the higher the risk of a price reduction.
About the Market Condition Indicators
As part of the CoreLogic HPI and HPI Forecasts offerings, Market Condition Indicators are available for all metropolitan areas and identify individual markets as overvalued, at value or undervalued. These indicators are derived from the long-term fundamental values, which are a function of real disposable income per capita. Markets are labeled as overvalued if the current home price indexes exceed their long-term values by greater than 10% and undervalued where the long-term values exceed the index levels by greater than 10%.
The data provided are for use only by the primary recipient or the primary recipient’s publication or broadcast. This data may not be resold, republished or licensed to any other source, including publications and sources owned by the primary recipient’s parent company without prior written permission from CoreLogic. Any CoreLogic data used for publication or broadcast, in whole or in part, must be sourced as coming from CoreLogic, a data and analytics company. For use with broadcast or web content, the citation must directly accompany first reference of the data. If the data are illustrated with maps, charts, graphs or other visual elements, the CoreLogic logo must be included on screen or website. For questions, analysis or interpretation of the data, contact Robin Wachner at newsmedia@corelogic.com. For sales inquiries, visit https://www.corelogic.com/support/sales-contact/. Data provided may not be modified without the prior written permission of CoreLogic. Do not use the data in any unlawful manner. The data are compiled from public records, contributory databases and proprietary analytics, and its accuracy is dependent upon these sources.
About CoreLogic
CoreLogic is a leading global property information, analytics and data-enabled solutions provider. The company’s combined data from public, contributory and proprietary sources includes over 4.5 billion records spanning more than 50 years, providing detailed coverage of property, mortgages and other encumbrances, consumer credit, tenancy, location, hazard risk and related performance information. The markets CoreLogic serves include real estate and mortgage finance, insurance, capital markets, and the public sector. CoreLogic delivers value to clients through unique data, analytics, workflow technology, advisory and managed services. Clients rely on CoreLogic to help identify and manage growth opportunities, improve performance and mitigate risk. Headquartered in Irvine, Calif., CoreLogic operates in North America, Western Europe and Asia Pacific. For more information, please visit www.corelogic.com.
Contact:
Robin Wachner – Media Contact – newsmedia@corelogic.com
Source: CoreLogic, Inc.
The Value of Membership

As the leading provider of in-depth business and credit information on the domestic lumber & forest products industry, a membership with Blue Book Services gives you access to:
- Ratings & Business Reports
- Dynamic Search Tools
- Real-Time Data