Fastenal Company Reports 2023 First Quarter Earnings

Fastenal Company (Nasdaq:FAST), a leader in the wholesale distribution of industrial and construction supplies, today announced its financial results for the quarter ended March 31, 2023. Except for share and per share information, or as otherwise noted below, dollar amounts are stated in millions. Throughout this document, percentage and dollar calculations, which are based on non-rounded dollar values, may not be able to be recalculated using the dollar values included in this document due to the rounding of those dollar values. References to daily sales rate (DSR) change may reflect either growth (positive) or contraction (negative) for the applicable period.
Performance Summary
Quarterly Results of Operations
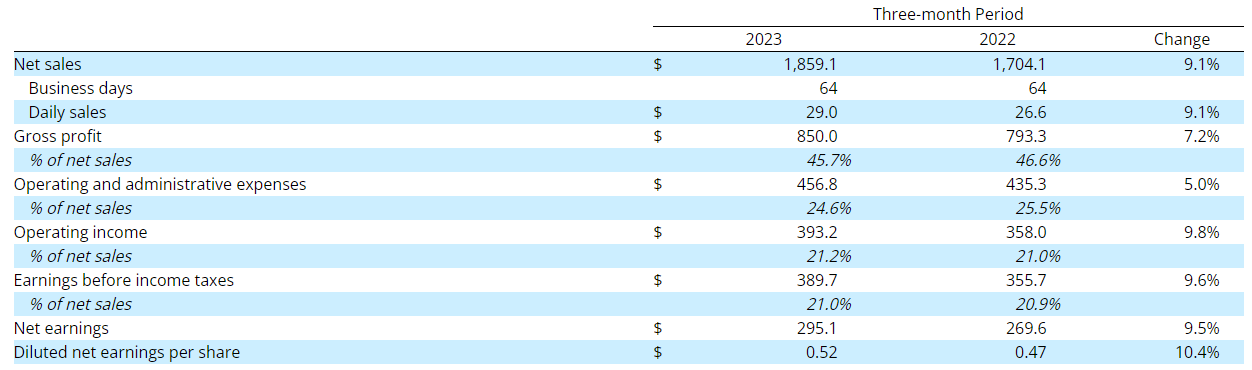
Net sales increased $155.0, or 9.1%, in the first quarter of 2023 when compared to the first quarter of 2022. The number of business days were the same in both periods. We experienced higher unit sales in the first quarter of 2023 that contributed to the increase in net sales in the period. This was due to further growth in underlying demand in markets tied to industrial capital goods and commodities, which more than offset a modest contraction for construction supplies. Foreign exchange negatively affected sales in the first quarter of 2023 by approximately 70 basis points, while adverse weather impacts in February 2023 negatively affected sales in the first quarter of 2023 by 20 to 40 basis points.
The impact of product pricing on net sales in the first quarter of 2023 was 290 to 320 basis points compared to the first quarter of 2022. The increase reflects carryover from broad pricing actions taken in the prior year designed to mitigate marketplace inflation for our products and services and, to a lesser degree, targeted actions in the first quarter of 2023 intended to address gross margin pressure for our non-fastener and non-safety products. Spot prices in the marketplace for many inputs remained below prior year levels, though in many cases they were at or above levels experienced in the fourth quarter of 2022. The combination of good demand, more stable cost trends, and our long supply chain for imported fasteners and certain non-fastener products produced stable price levels for our products. The impact of product pricing on net sales in the first quarter of 2022 was 580 to 610 basis points.
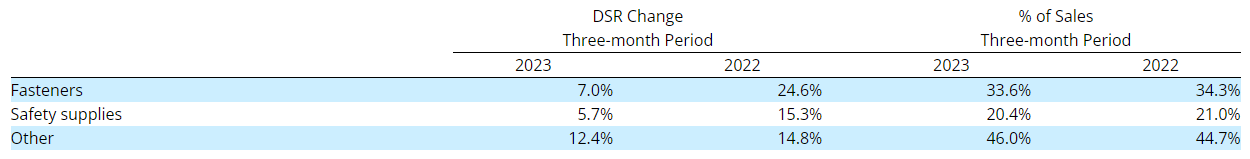
From a product standpoint, we have three categories: fasteners, safety supplies, and other product lines, the latter of which includes eight smaller product categories, such as tools, janitorial supplies, and cutting tools. The DSR change when compared to the same period in the prior year and the percent of sales in the period were as follows:
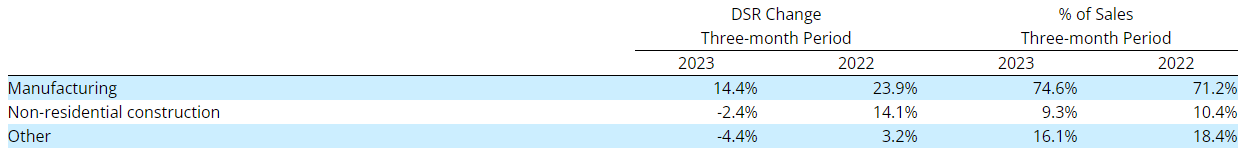
Our end markets consist of manufacturing, non-residential construction, and other, the latter of which includes resellers, government/education, and transportation/warehousing. The DSR change when compared to the same period in the prior year and the percent of sales in the period were as follows:
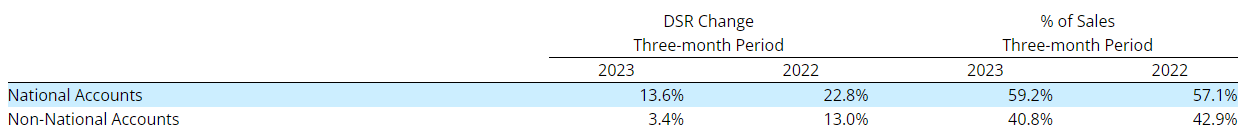
We report our customers in two categories: national accounts, which are customers with a multi-site contract, and non-national accounts, which include large regional customers, small local customers, and government customers. Sales to most of our national account customers grew in the first quarter of 2023 over the prior year, as our sales grew at 82 of our Top 100 national account customers. The DSR change when compared to the same period in the prior year and the percent of sales in the period were as follows:
Our gross profit, as a percentage of net sales, declined to 45.7% in the first quarter of 2023 from 46.6% in the first quarter of 2022. The change in our gross profit percentage primarily reflected four items. First, customer and product mix reduced our gross margin percentage. We experienced relatively strong growth from Onsite customers and non-fastener products, each of which tend to have a lower gross margin percentage than our business as a whole. This impact widened slightly on a sequential basis. Second, lower product margins in certain of our other product categories reduced our gross margin percentage. The combination of elevated costs and normalization of product availability for less frequently sold, often non-standard products where there is less visibility into the supply chain has produced some gross margin pressure. We took actions in the first quarter of 2023 to begin to address these pressures. Third, we had higher organizational/overhead costs, primarily due to higher inbound freight costs and working capital needs being relieved from inventory and generating higher period costs. Fourth, freight expenses were favorable, partially offsetting the negative impacts of mix, product gross margin pressure, and organizational/overhead costs. This favorable impact was from costs related to importing product from overseas suppliers being below prior year levels, the volume of containers being imported from overseas suppliers being lower, and record domestic freight revenue leveraging what are relatively stable costs to support our captive fleet.
Our operating income, as a percentage of net sales, increased to 21.2% in the first quarter of 2023 from 21.0% in the first quarter of 2022. This was due to improved operating expense leverage, which more than offset the decline in our gross profit percentage. Our operating and administrative expenses, as a percentage of net sales, fell to 24.6% in the first quarter of 2023 from 25.5% in the first quarter of 2022. This reflected declines, as a percentage of net sales, in employee-related and occupancy-related expenses.
Employee-related expenses, which represent 70% to 75% of total operating and administrative expenses, increased 4.4% in the first quarter of 2023 compared to the first quarter of 2022. We experienced an increase in employee base pay due to higher average FTE during the period and, to a lesser degree, higher average wages. Bonus and commission payments decreased reflecting the impact of slower sales and profit growth versus the prior year. We also experienced higher profit sharing costs. Occupancy-related expenses, which represent 15% to 20% of total operating and administrative expenses, increased 3.4% in the first quarter of 2023 compared to the first quarter of 2022. This increase largely reflects higher costs for FMI hardware as we continue to expand our installed base of such hardware. This was partly offset by slightly lower facility expenses as a result of further branch consolidation and lower utility costs. Combined, all other operating and administrative expenses, which represent 10% to 15% of total operating and administrative expenses, increased 10.7% in the first quarter of 2023 compared to the first quarter of 2022. The increase in other operating and administrative expenses relates primarily to higher spending on information technology, increased general insurance costs, and higher spending on travel expenses and supplies. This was only partly offset by lower product movement and fuel costs for our local truck fleet, reduced bad debt expense, and higher profits on sales of assets.
Our net interest expense was $3.5 in the first quarter of 2023, compared to $2.3 in the first quarter of 2022. This increase was due to higher average debt balances and higher average interest rates on those borrowings during the period.
We recorded income tax expense of $94.6 in the first quarter of 2023, or 24.3% of earnings before income taxes. Income tax expense was $86.1 in the first quarter of 2022, or 24.2% of earnings before income taxes. We believe our ongoing tax rate, absent any discrete tax items or broader changes to tax law, will be approximately 24.5%.
Our net earnings during the first quarter of 2023 were $295.1, an increase of 9.5% compared to the first quarter of 2022. Our diluted net earnings per share were $0.52 during the first quarter of 2023, which increased from $0.47 during the first quarter of 2022.
Growth Driver Performance
- We signed 89 new Onsite locations (defined as dedicated sales and service provided from within, or in proximity to, the customer’s facility) in the first quarter of 2023. We had 1,674 active sites on March 31, 2023, which represented an increase of 16.3% from March 31, 2022. Daily sales through our Onsite locations, excluding sales transferred from branches to new Onsites, grew roughly 20% in the first quarter of 2023 over the first quarter of 2022. This growth is due to contributions from Onsites activated and implemented over the last twelve months, as well as continued growth from our older Onsite locations. Our goal for Onsite signings in 2023 remains between 375 to 400.
- FMI Technology is comprised of our FASTStock? (scanned stocking locations), FASTBin® (infrared, RFID, and scaled bins), and FASTVend® (vending devices) offering. FASTStock’s fulfillment processing technology is not embedded, is relatively less expensive and highly flexible in application, and delivered using our proprietary mobility technology. FASTBin and FASTVend incorporate highly efficient and powerful embedded data tracking and fulfillment processing technologies. Prior to 2021, we reported exclusively on the signings, installations, and sales of FASTVend. Beginning in the first quarter of 2021, we began disclosing certain statistics around our FMI offering. The first statistic is a weighted FMI® measure which combines the signings and installations of FASTBin and FASTVend in a standardized machine equivalent unit (MEU) based on the expected output of each type of device. We do not include FASTStock in this measurement because scanned stocking locations can take many forms, such as bins, shelves, cabinets, pallets, etc., that cannot be converted into a standardized MEU. The second statistic is revenue through FMI Technology which combines the sales through FASTStock, FASTBin, and FASTVend. A portion of the growth in sales experienced by FMI, particularly FASTStock and FASTBin, reflects the migration of products from less efficient non-digital stocking locations to more efficient, digital stocking locations.
The table below summarizes the signings and installations of, and sales through, our FMI devices.
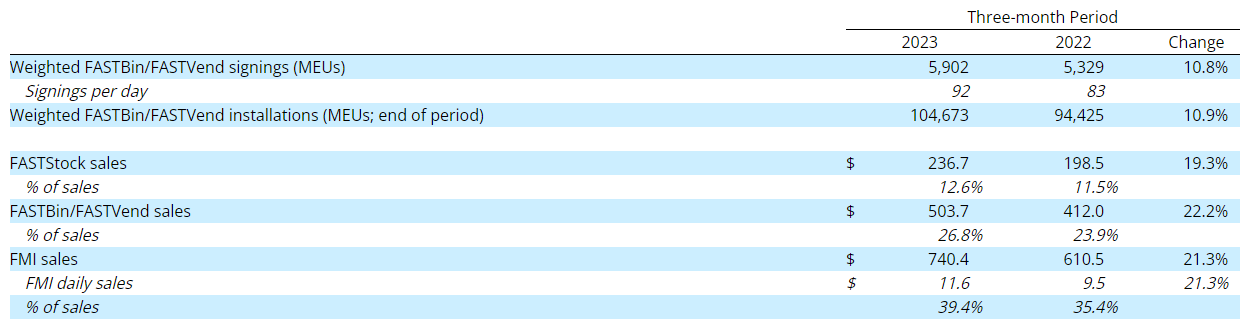
Our goal for weighted FASTBin and FASTVend device signings in 2023 remains between 23,000 to 25,000 MEUs.
- Our eCommerce business includes sales made through an electronic data interface (EDI), or other types of technical integrations, and through our web verticals. Daily sales through eCommerce grew 48.7% in the first quarter of 2023 and represented 21.9% of our total sales in the period.
Our digital products and services are comprised of sales through FMI (FASTStock, FASTBin, and FASTVend) plus that proportion of our eCommerce sales that do not represent billings of FMI services (collectively, our Digital Footprint). We believe the data that is created through our digital capabilities enhances product visibility, traceability, and control that reduces risk in operations and creates ordering and fulfillment efficiencies for both ourselves and our customers. As a result, we believe our opportunity to grow our business will be enhanced through the continued development and expansion of our digital capabilities.
Our Digital Footprint in the first quarter of 2023 represented 54.1% of our sales, an increase from 47.0% of sales in the first quarter of 2022.
Balance Sheet and Cash Flow
We produced operating cash flow of $388.5 in the first quarter of 2023, an increase of 68.9% from the first quarter of 2022, representing 131.7% of the period’s net earnings versus 85.3% in the first quarter of 2022. The improvement in operating cash flow as a percent of net earnings is due to working capital being a source of cash in the first quarter of 2023, versus working capital being a significant use of cash in the first quarter of 2022. Global supply chains have normalized versus the prior year, resulting in a reduction in the amount of working capital necessary to keep on hand to support our customers’ growth.
The dollar and percentage change in accounts receivable, net, inventories, and accounts payable as of March 31, 2023 when compared to March 31, 2022 were as follows:
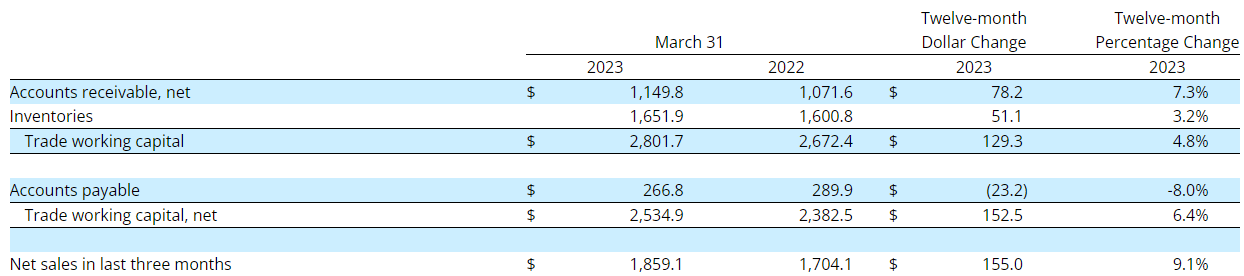
Note – Amounts may not foot due to rounding difference.
The increase in our accounts receivable balance in the first quarter of 2023 is primarily attributable to two factors. First, our receivables increased as a result of expanding business activity and resulting growth in our customers’ sales. Second, we continue to experience a shift in our mix due to relatively stronger growth from national account customers, which tend to carry longer payment terms than our non-national account customers.
The increase in our inventory balance in the first quarter of 2023 is primarily attributable to supporting the improved business activity of our customers. We were able to provide this support even while growing inventory at a slower rate than sales. This reflects the absence of supply disruptions from the prior year that we managed by deepening our inventory, especially imported inventory, and which has allowed us to begin gradually shortening our product ordering cycle.
The decrease in our accounts payable balance in the first quarter of 2023 is primarily attributable to the dissipation of supply disruptions from the prior year. That allowed us to gradually begin to shorten our product ordering cycle and reduce the volume of product purchases in the first quarter of 2023 versus the first quarter of 2022.
During the first quarter of 2023, our investment in property and equipment, net of proceeds from sales, was $30.9, which is a decrease from $33.1 in the first quarter of 2022. During the full year of 2023, we continue to expect our investment in property and equipment, net of proceeds of sales, to be within a range of $210.0 to $230.0, increasing from $162.4 in 2022. This increase reflects primarily: (1) higher property-related spending on upgrades to and investments in automation of certain facilities, the beginning of construction of a distribution center in Utah, and investment in materials to facilitate our branch conversion projects; (2) investments in fleet equipment to support our network of heavy trucks; and (3) an increase in spending on information technology.
During the first quarter of 2023, we returned $199.8 in dividends to our shareholders, compared to the first quarter of 2022 when we returned $178.4 in dividends. We did not repurchase our common stock in either period.
Total debt on our balance sheet was $400.0 at the end of the first quarter of 2023, or 10.9% of total capital (the sum of stockholders’ equity and total debt). This compares to $365.0, or 10.4% of total capital, at the end of the first quarter of 2022.
Additional Information
The table below summarizes our absolute and full time equivalent (FTE; based on 40 hours per week) employee headcount, our investments related to in-market locations (defined as the sum of the total number of branch locations and the total number of active Onsite locations), and weighted FMI devices at the end of the periods presented and the percentage change compared to the end of the prior periods.
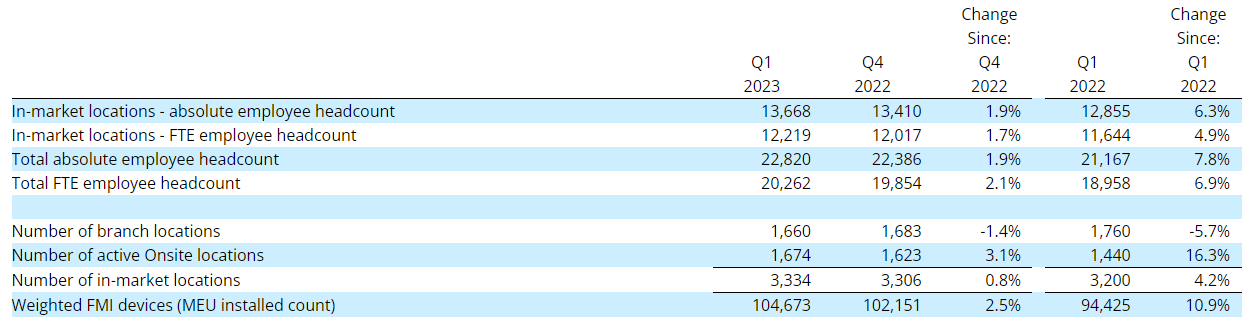
During the last twelve months, we increased our total FTE employee headcount by 1,304. This reflects an increase in our in-market and non-in-market selling FTE employee headcount of 863 to support growth in the marketplace and sales initiatives targeting customer acquisition. We had an increase in our distribution center FTE employee headcount of 173 to support increased product throughput at our facilities and to expand our local inventory fulfillment terminals (LIFTs). We had an increase in our remaining FTE employee headcount of 268 that relates primarily to personnel investments in information technology, manufacturing, and operational support, such as purchasing and product development.
The table below summarizes the number of branches opened and closed, net of conversions, as well as the number of Onsites activated and closed, net of conversions during the periods presented.
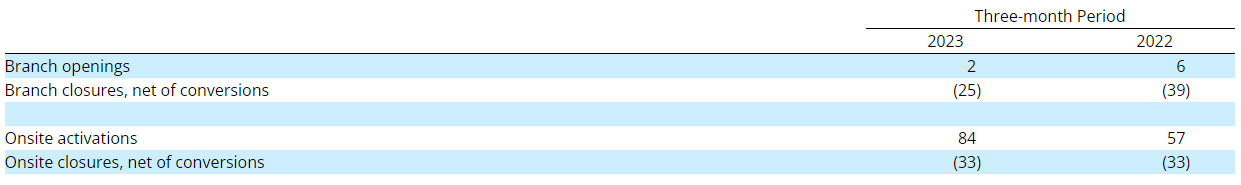
In any period, the number of closings tends to reflect normal churn in our business, whether due to redefining or exiting customer relationships, the shutting or relocation of customer facilities that host our locations, or a customer decision, as well as our ongoing review of underperforming locations. Our in-market network forms the foundation of our business strategy, and we will continue to open or close locations as is deemed necessary to sustain and improve our network, support our growth drivers, and manage our operating expenses.
For the complete press release, click here.
Contact:
Taylor Ranta Oborski – Financial Reporting & Regulatory Compliance Manager – (507) 313-7959
Source: Fastenal Company
The Value of Membership

As the leading provider of in-depth business and credit information on the domestic lumber & forest products industry, a membership with Blue Book Services gives you access to:
- Ratings & Business Reports
- Dynamic Search Tools
- Real-Time Data