NAHB: Inflation Slows to Lowest Level Since March 2021
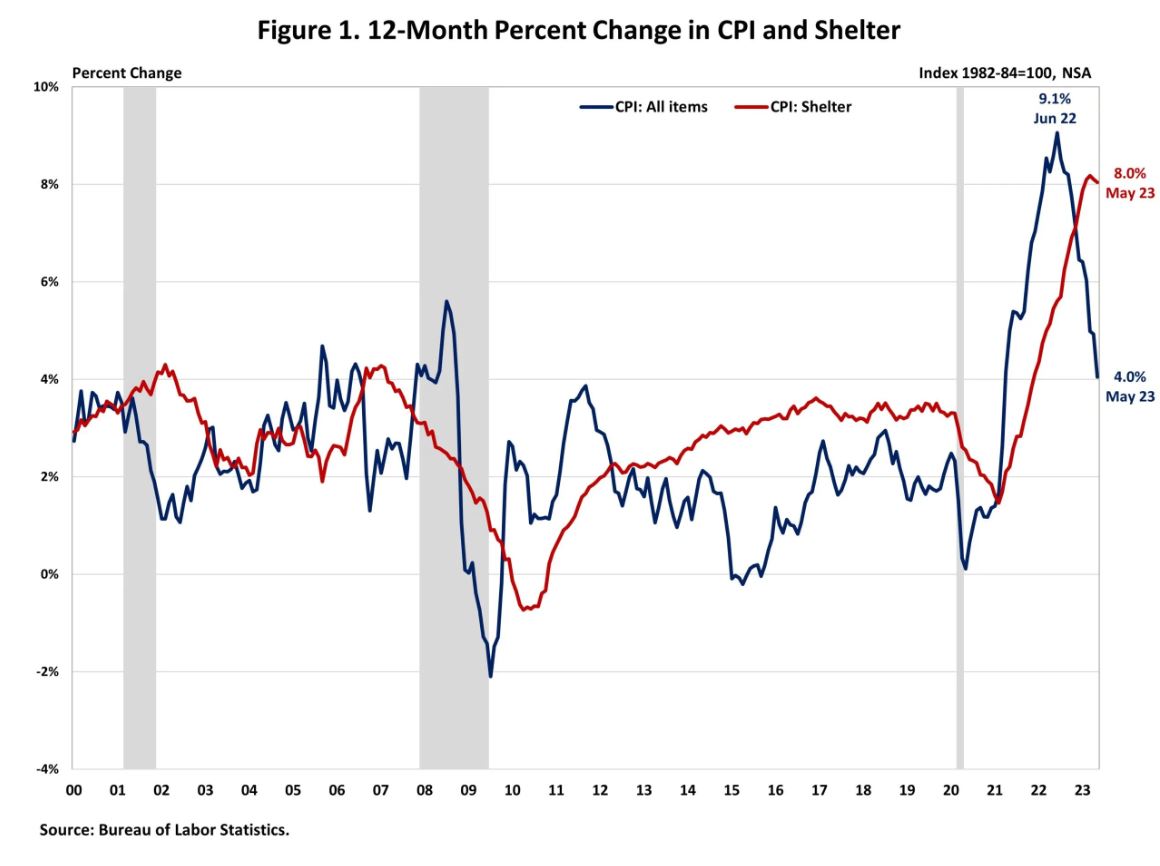
Consumer prices in May saw the smallest year-over-year gain since March 2021, mainly driven by lower energy prices. This marked the eleventh consecutive month of deceleration. While this measure aligned with expectations, core inflation remained persistent due to the increase in rent prices. The shelter index (housing inflation) continued to be the largest contributor to both headline and core inflation, accounting for over 60% of the increase in all items excluding food and energy.
The Fed’s ability to address rising housing costs is limited as shelter cost increases are driven by a lack of affordable supply and increasing development costs. Additional housing supply is the primary solution to tame housing inflation. The Fed’s tools for promoting housing supply are at best limited. In fact, further tightening of monetary policy will hurt housing supply by increasing the cost of AD&C financing. This can be seen on the graph below, as shelter costs continue to rise despite Fed policy tightening. Nonetheless, the NAHB forecast expects to see shelter costs decline later in 2023, supported by real-time data from private data providers that indicate a cooling in rent growth.
The Bureau of Labor Statistics (BLS) reported that the Consumer Price Index (CPI) rose by 0.1% in May on a seasonally adjusted basis, following an increase of 0.4% in April. The price index for a broad set of energy sources fell by 3.6% in May as the gasoline index (-5.6%), the natural gas index (-2.6%) and the electricity index (-1.0%) all decreased. Excluding the volatile food and energy components, the “core” CPI rose by 0.4% in May, as it did in April and March. Meanwhile, the food index increased by 0.2% in May with the food at home index rising 0.1%.
In May, the indexes for shelter (+0.4%), used cars and trucks (4.4%) and motor vehicle insurance (2.0%) were the largest contributors to the increase in the headline CPI. Meanwhile, the indexes for household furnishings and operations (-0.6%) and airline fares (-3.0%) declined in May.
The index for shelter, which makes up more than 40% of the “core” CPI, rose by 0.6% in May, following an increase of 0.4% in April. Both the indexes for owners’ equivalent rent (OER) and rent of primary residence (RPR) increased by 0.5% over the month. Monthly increases in OER have averaged 0.6% over the last five months. These gains have been the largest contributors to headline inflation in recent months.
During the past twelve months, on a not seasonally adjusted basis, the CPI rose by 4.0% in May, following a 4.9% increase in April. This was the slowest annual gain since March 2021. The “core” CPI increased by 5.3% over the past twelve months, following a 5.5% increase in April. The food index rose by 6.7% while the energy index fell by 11.7% over the past twelve months.
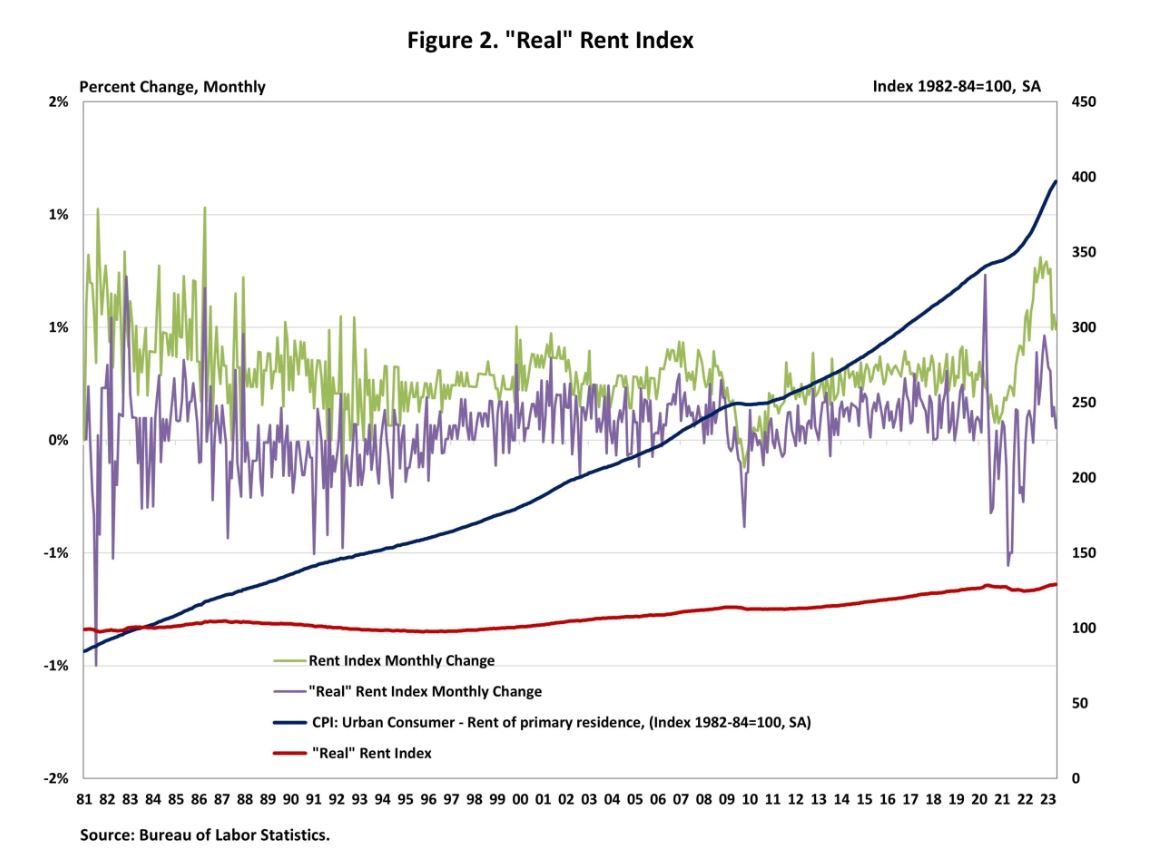
NAHB constructs a “real” rent index to indicate whether inflation in rents is faster or slower than overall inflation. It provides insight into the supply and demand conditions for rental housing. When inflation in rents is rising faster (slower) than overall inflation, the real rent index rises (declines). The real rent index is calculated by dividing the price index for rent by the core CPI (to exclude the volatile food and energy components). The Real Rent Index rose by 0.1% in May.
To view the original report, click here.
Source: National Association of Home Builders
The Value of Membership

As the leading provider of in-depth business and credit information on the domestic lumber & forest products industry, a membership with Blue Book Services gives you access to:
- Ratings & Business Reports
- Dynamic Search Tools
- Real-Time Data