Statistics Canada: Investment in Building Construction, April 2023
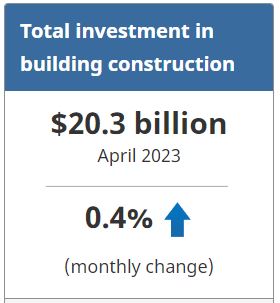
Investment in building construction went up by 0.4% to $20.3 billion in April. The residential sector edged down 0.7% to $14.4 billion, while the non-residential sector was up by 3.4% to $5.9 billion.
On a constant dollar basis (2012=100), investment in building construction grew 2.3% to $11.8 billion.
Single-family unit construction brings down residential investment
Investment in residential building construction was down 0.7% to $14.4 billion in April.
Investment in single-family homes declined 2.1% to $7.7 billion in April, the lowest level since November 2021. In April 2023, notable gains from Nova Scotia (+15.2%; +$52.8 million) were offset by declines in Ontario (-4.2%; -$146.4 million) and Quebec (-4.4%; -$67.3 million).
Multi-unit construction increased 0.8% to $6.7 billion, hovering around this value since December 2022.
Non-residential construction investment up across all components
Investment in non-residential construction continued to grow, up 3.4% to $5.9 billion in April. This was the largest recorded monthly increase since June 2020 for the sector. This followed a 32.0% monthly increase in the value of building permits reported in March 2023, as it reached record-high levels for non-residential construction intentions.
Industrial construction investment rose 5.4% to $1.2 billion in April. The start of construction of a new manufacturing building in Bécancour, Quebec helped lead the province to its 20th consecutive monthly increase in the component.
Commercial construction investment advanced 3.7% to $3.2 billion, with Ontario (+6.7%; +$86.2 million) contributing the most to the growth. This was the 11th consecutive monthly increase for the component.
Institutional construction investment increased 1.2% to $1.4 billion in April. Overall, seven provinces posted gains, led by Ontario (+2.5%; +$12.9 million).
For more information on construction, please visit the Construction statistics portal.
For more information on housing, please visit the Housing statistics portal.
Note to readers
Data are subject to revisions based on late responses, methodological changes and classification updates. Unadjusted data have been revised for the previous two months. Seasonally adjusted data have been revised for the previous three months.
Data presented in this release are seasonally adjusted with current dollar values unless otherwise stated. Using seasonally adjusted data allows month-to-month and quarter-to-quarter comparisons by removing the effects of seasonal variations. For information on seasonal adjustment, see Seasonally adjusted data – Frequently asked questions.
Monthly estimates in constant dollars are calculated using quarterly deflators from the Building Construction Price Index (table 18-10-0135-01). Typically, the first two months of a quarter use the previous quarter’s price level, and the data are revised when the new quarterly price index becomes available.
Detailed data on investment activity by type of building and type of work are now available in the unadjusted current dollar series.
The trade and services subcomponent includes buildings such as retail and wholesale outlets, retail complexes, and motor vehicle show rooms. More detailed information can be found on the Integrated Metadatabase at Types of Building Structure – 2.2.1 – Trade and services.
Next release
Data on investment in building construction for May will be released on July 19.
Products
Statistics Canada has a “Housing Market Indicators” dashboard. This web application provides access to key housing market indicators for Canada, by province and census metropolitan area. These indicators are automatically updated with new information from monthly releases, giving users access to the latest data.
Source: Statistics Canada
The Value of Membership

As the leading provider of in-depth business and credit information on the domestic lumber & forest products industry, a membership with Blue Book Services gives you access to:
- Ratings & Business Reports
- Dynamic Search Tools
- Real-Time Data