Statistics Canada: Building Permits May 2023
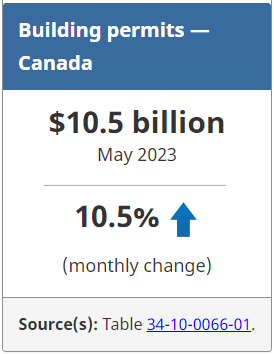
The total monthly value of building permits in Canada increased 10.5% in May to $10.5 billion.
On a constant dollar basis (2012=100), the total value of building permits increased 10.0% to $6.2 billion.
Ontario bolsters growth in residential construction intentions
The total monthly value of residential permits rose 8.5% to $6.8 billion in May, with Ontario contributing to 45.8% of Canada’s residential permit values.
Ontario increased 16.3% month over month to $3.1 billion, led by multi-dwelling permits issued in urban areas. New Brunswick (+27.2% or +$22.2 million) had the highest provincial growth rate, while Quebec (+10.8% or +$102.3 million), Alberta (+4.7% or +$34.5 million) and British Columbia (+3.7% or +$50.3 million) observed more modest gains.
Across Canada, permits for 3,800 new residential units were issued for single-family homes in May, compared with permits for 17,700 new dwellings in multi-unit buildings.
Commercial projects push non-residential permits up
The total monthly value of non-residential permits rose 14.2% to $3.7 billion in May.
Commercial permits surged (+45.8% or +$703.4 million), more than offsetting monthly losses in the institutional component (-23.3% or -$251.3 million).
Despite overall monthly gains, the value of non-residential construction intentions in May was down 11.2% year over year.
To explore data using an interactive user interface, visit the Building permits: Interactive Dashboard.
For more information on construction, please visit the Construction statistics portal.
For more information on housing, please visit the Housing statistics portal.
Statistics Canada has a Housing Market Indicators dashboard. This web application provides access to key housing market indicators for Canada, by province and by census metropolitan area. The indicators are updated automatically with new information from monthly releases, giving users access to the latest data.
Note to readers
Unless otherwise stated, this release presents seasonally adjusted data with current dollar values, which facilitate month-to-month and quarter-to-quarter comparisons by removing the effects of seasonal variations. For information on seasonal adjustment, see Seasonally adjusted data – Frequently asked questions.
Building components
- Single-family dwellings: Residential buildings containing only one dwelling unit (e.g., single-detached house, bungalow, linked home [linked at the foundation]).
- Multi-family dwellings: Residential buildings containing multiple dwelling units (e.g., apartment, apartment condominium, row house, semi-detached house).
- Industrial buildings: Buildings used in the processing or production of goods or related to transportation and communication.
- Commercial buildings: Buildings used in the trade or distribution of goods and services, including office buildings.
- Institutional and government buildings: Buildings used to house public and semi-public services, such as those related to health and welfare, education or public administration, and buildings used for religious services.
Revision
Data are subject to revisions based on late responses, methodological changes and classification updates. Unadjusted data have been revised for the previous month. Seasonally adjusted data have been revised for the previous three months.
As per Statistics Canada practices, data from January 2022 to December 2022 have also been revised with this release.
For information on trend-cycle data, see the StatCan Blog and Trend-cycle estimates – Frequently asked questions.
Next release
Data on building permits for June will be released on August 9.
Source: Statistics Canada
The Value of Membership

As the leading provider of in-depth business and credit information on the domestic lumber & forest products industry, a membership with Blue Book Services gives you access to:
- Ratings & Business Reports
- Dynamic Search Tools
- Real-Time Data