NAR: Existing-Home Sales Slipped 2.2% in July

Existing-home sales receded in July, according to the National Association of Realtors®. Among the four major U.S. regions, sales grew in the West but faded in the Northeast, Midwest and South. All four regions registered year-over-year sales declines.
Key Highlights
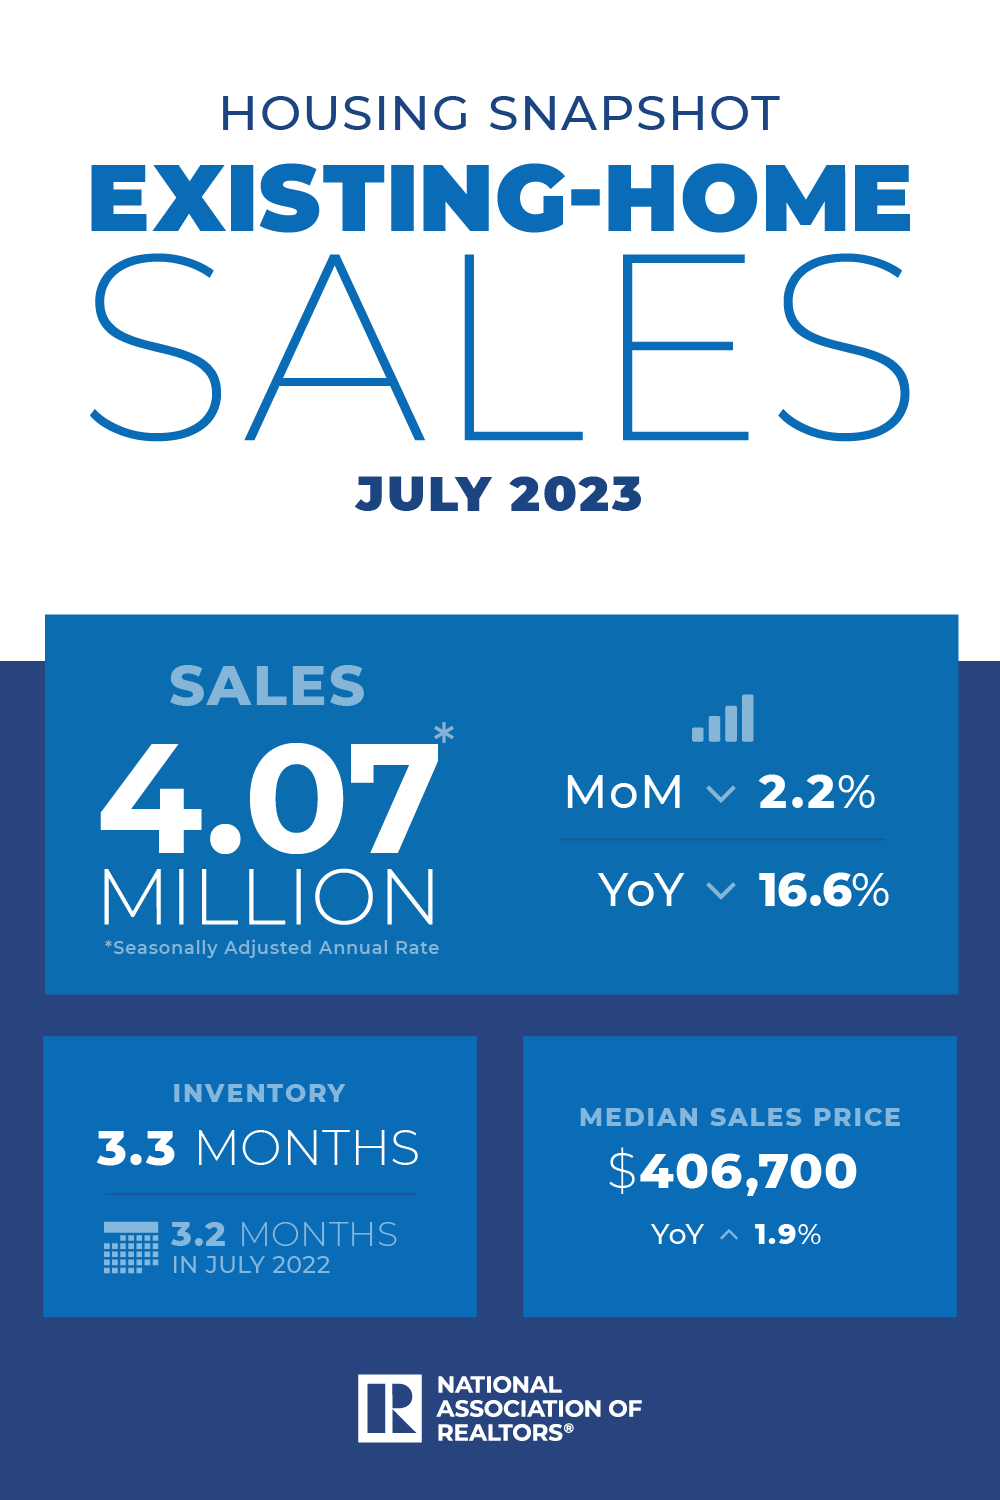
- Existing-home sales fell 2.2% in July to a seasonally adjusted annual rate of 4.07 million. Sales receded 16.6% from one year ago.
- The median existing-home sales price rose 1.9% from one year ago to $406,700. It was the fourth time the monthly median sales price eclipsed $400,000, joining June 2023 ($410,000), June 2022 ($413,800) and May 2022 ($408,600).
- The inventory of unsold existing homes increased 3.7% from the previous month to 1.11 million at the end of July, or the equivalent of 3.3 months’ supply at the current monthly sales pace.
Total existing-home sales1 – completed transactions that include single-family homes, townhomes, condominiums and co-ops – waned 2.2% from June to a seasonally adjusted annual rate of 4.07 million in July. Year-over-year, sales slumped 16.6% (down from 4.88 million in July 2022).
“Two factors are driving current sales activity – inventory availability and mortgage rates,” said NAR Chief Economist Lawrence Yun. “Unfortunately, both have been unfavorable to buyers.”
Total housing inventory2 registered at the end of July was 1.11 million units, up 3.7% from June but down 14.6% from one year ago (1.3 million). Unsold inventory sits at a 3.3-month supply at the current sales pace, up from 3.1 months in June and 3.2 months in July 2022.
The median existing-home price3 for all housing types in July was $406,700, an increase of 1.9% from July 2022 ($399,000). Prices rose in the Northeast, Midwest and South but were unchanged in the West.
“Most homeowners continue to enjoy large wealth gains from recent years with little concern about home price declines,” Yun said. “However, many renters are concerned as they’re facing growing affordability challenges because of high interest rates.”
REALTORS® Confidence Index
According to the REALTORS® Confidence Index, properties typically remained on the market for 20 days in July, up from 18 days in June and 14 days in July 2022. Seventy-four percent of homes sold in July were on the market for less than a month.
First-time buyers were responsible for 30% of sales in July, up from 27% in June and 29% in July 2022. NAR’s 2022 Profile of Home Buyers and Sellers – released in November 20224 – found that the annual share of first-time buyers was 26%, the lowest since NAR began tracking the data.
All-cash sales accounted for 26% of transactions in July, identical to June but up from 24% in July 2022.
Individual investors or second-home buyers, who make up many cash sales, purchased 16% of homes in July, down from 18% in June but up from 14% one year ago.
Distressed sales5 – foreclosures and short sales – represented 1% of sales in July, virtually unchanged from last month and the previous year.
Mortgage Rates
According to Freddie Mac, the 30-year fixed-rate mortgage(link is external) averaged 7.09% as of August 17. That’s up from 6.96% the prior week and 5.13% one year ago.
“Retreating mortgage rates will bring more buyers and sellers to the market and get Americans moving again,” Yun said.
Single-family and Condo/Co-op Sales
Single-family home sales slid to a seasonally adjusted annual rate of 3.65 million in July, down 1.9% from 3.72 million in June and 16.3% from the previous year. The median existing single-family home price was $412,300 in July, up 1.6% from July 2022.
Existing condominium and co-op sales recorded a seasonally adjusted annual rate of 420,000 units in July, down 4.5% from June and 19.2% from one year ago. The median existing condo price was $357,600 in July, up 4.5% from the previous year ($342,200).
Regional Breakdown
Existing-home sales in the Northeast descended 5.9% from June to an annual rate of 480,000 in July, down 23.8% from July 2022. The median price in the Northeast was $467,500, up 5.5% from one year ago.
In the Midwest, existing-home sales decreased by 3.0% from the prior month to an annual rate of 960,000 in July, dropping 20.0% from the previous year. The median price in the Midwest was $304,600, up 3.9% from July 2022.
Existing-home sales in the South retracted 2.6% from June to an annual rate of 1.86 million in July, a decrease of 14.3% from one year ago. The median price in the South was $366,200, up 1.7% from July 2022.
In the West, existing-home sales increased 2.7% from the previous month to an annual rate of 770,000 in July, down 12.5% from the prior year. The median price in the West was $610,500, unchanged from July 2022.
About NAR
The National Association of Realtors® is America’s largest trade association, representing more than 1.5 million members involved in all aspects of the residential and commercial real estate industries. The term Realtor® is a registered collective membership mark that identifies a real estate professional who is a member of the National Association of Realtors® and subscribes to its strict Code of Ethics.
# # #
For local information, please contact the local association of Realtors® for data from local multiple listing services (MLS). Local MLS data is the most accurate source of sales and price information in specific areas, although there may be differences in reporting methodology.
NOTE: NAR’s Pending Home Sales Index for July is scheduled for release on August 30, and Existing-Home Sales for August will be released on September 21. Release times are 10 a.m. Eastern.
1 Existing-home sales, which include single-family, townhomes, condominiums and co-ops, are based on transaction closings from Multiple Listing Services. Changes in sales trends outside of MLSs are not captured in the monthly series. NAR benchmarks home sales periodically using other sources to assess overall home sales trends, including sales not reported by MLSs. Existing-home sales, based on closings, differ from the U.S. Census Bureau’s series on new single-family home sales, which are based on contracts or the acceptance of a deposit. Because of these differences, it is not uncommon for each series to move in different directions in the same month. In addition, existing-home sales, which account for more than 90% of total home sales, are based on a much larger data sample – about 40% of multiple listing service data each month – and typically are not subject to large prior-month revisions. The annual rate for a particular month represents what the total number of actual sales for a year would be if the relative pace for that month were maintained for 12 consecutive months. Seasonally adjusted annual rates are used in reporting monthly data to factor out seasonal variations in resale activity. For example, home sales volume is normally higher in the summer than in the winter, primarily because of differences in the weather and family buying patterns. However, seasonal factors cannot compensate for abnormal weather patterns. Single-family data collection began monthly in 1968, while condo data collection began quarterly in 1981; the series were combined in 1999 when monthly collection of condo data began. Prior to this period, single-family homes accounted for more than nine out of 10 purchases. Historic comparisons for total home sales prior to 1999 are based on monthly single-family sales, combined with the corresponding quarterly sales rate for condos.
2 Total inventory and month’s supply data are available back through 1999, while single-family inventory and month’s supply are available back to 1982 (prior to 1999, single-family sales accounted for more than 90% of transactions and condos were measured only on a quarterly basis).
3 The median price is where half sold for more and half sold for less; medians are more typical of market conditions than average prices, which are skewed higher by a relatively small share of upper-end transactions. The only valid comparisons for median prices are with the same period a year earlier due to seasonality in buying patterns. Month-to-month comparisons do not compensate for seasonal changes, especially for the timing of family buying patterns. Changes in the composition of sales can distort median price data. Year-ago median and mean prices sometimes are revised in an automated process if additional data is received. The national median condo/co-op price often is higher than the median single-family home price because condos are concentrated in higher-cost housing markets. However, in a given area, single-family homes typically sell for more than condos as seen in NAR’s quarterly metro area price reports.
4 Survey results represent owner-occupants and differ from separately reported monthly findings from NAR’s Realtors® Confidence Index, which include all types of buyers. The annual study only represents primary residence purchases, and does not include investor and vacation home buyers. Results include both new and existing homes.
5 Distressed sales (foreclosures and short sales), days on market, first-time buyers, all-cash transactions and investors are from a monthly survey for the NAR’s Realtors® Confidence Index, posted at nar.realtor.
Contact:
Troy Green – Media Contact – (202) 383-1042
Source: National Association of Realtors
The Value of Membership

As the leading provider of in-depth business and credit information on the domestic lumber & forest products industry, a membership with Blue Book Services gives you access to:
- Ratings & Business Reports
- Dynamic Search Tools
- Real-Time Data