CoreLogic: US Annual Home Price Growth Picks Up Pace in August

- U.S. home prices increased year over year for the 139th consecutive month in August.
- Home prices are 42% higher compared with March 2020, when the pandemic began.
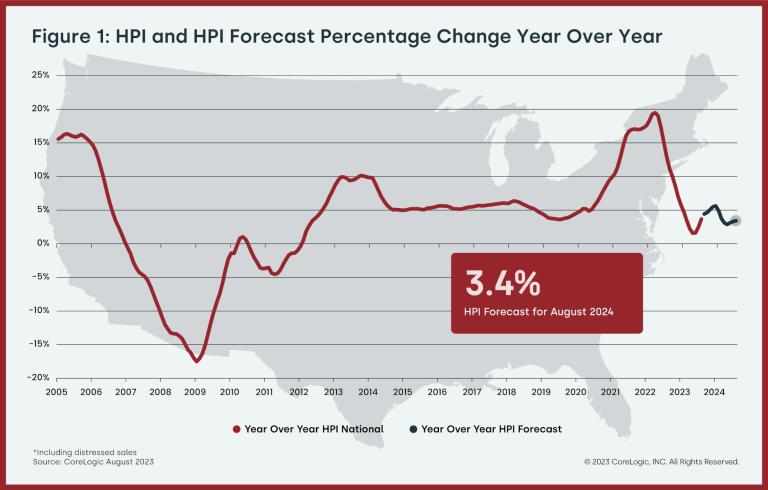
- August’s annual 3.7% home price gain was the highest since February 2023.
- CoreLogic projects that year-over-year home price appreciation will relax slightly by August 2024 to 3.4%.
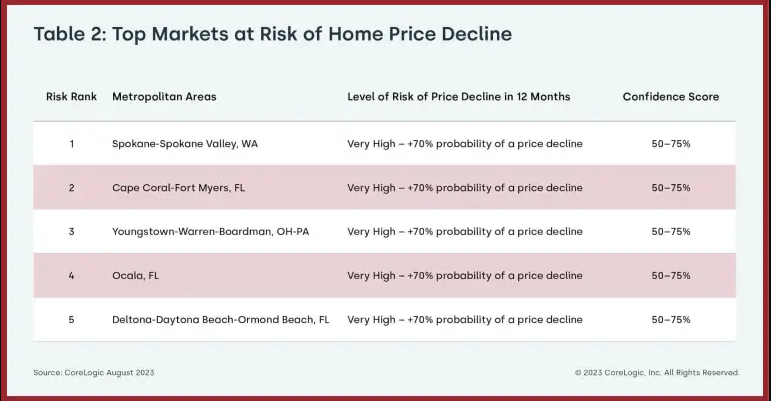
- Eight states, mostly in the West, saw year-over-year home price declines, the fewest since February 2023.
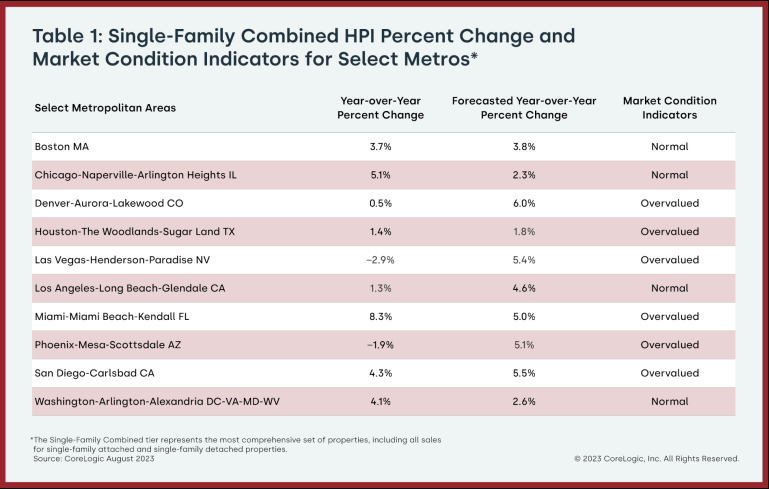
- Of large metro areas, Miami continued to lead the country for annual home price growth, with an 8.3% gain.
- The median sales price for a U.S. single-family home remained at $375,000 in August, with California ($705,000), the District of Columbia ($630,000) and Massachusetts ($585,000) again leading the nation.
CoreLogic®, a leading global property information, analytics and data-enabled solutions provider, today released the CoreLogic Home Price Index (HPI™) and HPI Forecast™ for August 2023.
CoreLogic’s Home Price Index dropped to an 11-year low in the spring of 2023 but is starting to regain momentum. While some states in the West still posted annual home price losses in August, that number has been decreasing since the spring of this year. Meanwhile, housing markets in New England are starting to heat up, with New Hampshire, Maine, Vermont and Rhode Island seeing the largest year-over-year price gains in August.
“While continued mortgage rate increases challenge affordability across U.S. housing markets, home price growth is in line with typical seasonal averages, reflecting strong demand bolstered by a healthy labor market, strong wage growth and supporting demographic trends,“ said Selma Hepp, chief economist for CoreLogic. “Still, with a slower buying season ahead and the surging cost of homeownership, additional monthly price gains may taper off.”
Top Takeaways
- U.S. home prices (including distressed sales) increased by 3.7% year over year in August 2023 compared with August 2022. On a month-over-month basis, home prices rose by 0.3% compared with July 2023.
- In August, the annual appreciation of detached properties (3.7%) was 0.2 percentage points higher than that of attached properties (3.5%).
- CoreLogic’s forecast shows annual U.S. home price gains at 3.4% by August 2024.
- Miami posted the highest year-over-year home price increase of the country’s 20 tracked metro areas in June, at 8.3%. St. Louis saw the next-highest gain (6.4%), followed by Charlotte, North Carolina (5.4%).
- Among states, New Hampshire ranked first for annual appreciation in July (up by 9.4%), followed by Maine and Vermont (both up by 8.9%). Eight states recorded home price losses: Idaho (-4%), Montana (-2.7%), Nevada (-2.3%), Utah (-2%), Washington (-1%), Arizona (-0.9%), Texas (-0.4%) and New York (-0.2%).
The next CoreLogic HPI press release, featuring September 2023 data, will be issued on November 7, 2023, at 8 a.m. EST.
To view the original post, click here.
Methodology
The CoreLogic HPI™ is built on industry-leading public record, servicing and securities real-estate databases and incorporates more than 45 years of repeat-sales transactions for analyzing home price trends. Generally released on the first Tuesday of each month with an average five-week lag, the CoreLogic HPI is designed to provide an early indication of home price trends by market segment and for the Single-Family Combined tier, representing the most comprehensive set of properties, including all sales for single-family attached and single-family detached properties. The indices are fully revised with each release and employ techniques to signal turning points sooner. The CoreLogic HPI provides measures for multiple market segments, referred to as tiers, based on property type, price, time between sales, loan type (conforming vs. non-conforming) and distressed sales. Broad national coverage is available from the national level down to ZIP Code, including non-disclosure states.
CoreLogic HPI Forecasts™ are based on a two-stage, error-correction econometric model that combines the equilibrium home price—as a function of real disposable income per capita—with short-run fluctuations caused by market momentum, mean-reversion, and exogenous economic shocks like changes in the unemployment rate. With a 30-year forecast horizon, CoreLogic HPI Forecasts project CoreLogic HPI levels for two tiers — Single-Family Combined (both attached and detached) and Single-Family Combined Excluding Distressed Sales. As a companion to the CoreLogic HPI Forecasts, Stress-Testing Scenarios align with Comprehensive Capital Analysis and Review (CCAR) national scenarios to project five years of home prices under baseline, adverse and severely adverse scenarios at state, metropolitan areas and ZIP Code levels. The forecast accuracy represents a 95% statistical confidence interval with a +/- 2% margin of error for the index.
About Market Risk Indicators
Market Risk Indicators are a subscription-based analytics solution that provide monthly updates on the overall health of housing markets across the country. CoreLogic data scientists combine world-class analytics with detailed economic and housing data to help determine the likelihood of a housing bubble burst in 392 major metros and all 50 states. Market Risk Indicators is a multi-phase regression model that provides a probability score (from 1 to 100) on the likelihood of two scenarios per metro: a >10% price reduction and a = 10% price reduction. The higher the score, the higher the risk of a price reduction.
About the Market Condition Indicators
As part of the CoreLogic HPI and HPI Forecasts offerings, Market Condition Indicators are available for all metropolitan areas and identify individual markets as overvalued, at value or undervalued. These indicators are derived from the long-term fundamental values, which are a function of real disposable income per capita. Markets are labeled as overvalued if the current home price indexes exceed their long-term values by greater than 10% and undervalued where the long-term values exceed the index levels by greater than 10%.
About CoreLogic
CoreLogic is a leading global property information, analytics and data-enabled solutions provider. The company’s combined data from public, contributory and proprietary sources includes over 4.5 billion records spanning more than 50 years, providing detailed coverage of property, mortgages and other encumbrances, consumer credit, tenancy, location, hazard risk and related performance information. The markets CoreLogic serves include real estate and mortgage finance, insurance, capital markets, and the public sector. CoreLogic delivers value to clients through unique data, analytics, workflow technology, advisory and managed services. Clients rely on CoreLogic to help identify and manage growth opportunities, improve performance and mitigate risk. Headquartered in Irvine, Calif., CoreLogic operates in North America, Western Europe and Asia Pacific. For more information, please visit www.corelogic.com.
Contact:
Robin Wachner – Media Contact – newsmedia@corelogic.com
Source: CoreLogic
The Value of Membership

As the leading provider of in-depth business and credit information on the domestic lumber & forest products industry, a membership with Blue Book Services gives you access to:
- Ratings & Business Reports
- Dynamic Search Tools
- Real-Time Data