Statistics Canada: Building Permits September 2023
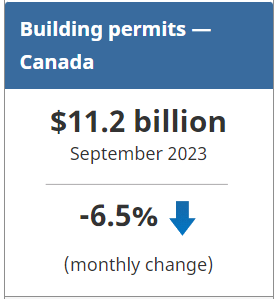
The total monthly value of building permits in Canada decreased 6.5% in September to $11.2 billion, with most of the drop attributed to the monthly decline in the institutional component.
On a constant dollar basis (2012=100), the total value of building permits was down 7.5% to $6.4 billion in September.
Housing intentions in British Columbia lead overall gains in residential sector
The total monthly value of residential permits increased 4.3% to $7.2 billion in September, led by a 37.2% monthly increase in construction intentions in British Columbia. Residential permits issued in the census metropolitan areas (CMAs) of Vancouver, Kelowna, and Victoria together made up 77.3% of the value of residential permits and 79.9% of the number of new dwellings authorized for the province in September.
Monthly gains in the value of residential permits in Newfoundland and Labrador (+20.8%; +$6.0 million), Prince Edward Island (+16.2%; +$4.8 million), Nova Scotia (+10.3%; +$18.5 million), and Quebec (+9.1%; +$105.2 million) offset the declines in the remaining five provinces.
Across Canada, 21,700 new dwelling units were authorized through building permits in September, 5.6% more than August 2023 and 2.3% more than September 2022.
Despite monthly decline in non-residential building permits, sector still stronger than a year earlier
The total monthly value of non-residential permits fell 21.0% from August to $4.0 billion in September. This drop was attributed to the decline in construction intentions for the institutional component (-50.7% to $1.0 billion), following a record high for the component in August ($2.1 billion) which saw permits issued for several high valued construction projects.
Despite the sharp month-over-month decline, the total value of non-residential building permits in September 2023 ($4.0 billion) was 18.7% higher than September 2022 ($3.4 billion), as construction intentions in the non-residential sector have been steadily trending upwards over the course of the past 12 months. This trend also holds true on a constant dollar basis, which removes the impact of changes in construction costs on the value of building permits.
Third quarter saw higher total construction intentions for both residential and non-residential permits
The total value of building permits in the third quarter of 2023 rose 4.9% from the second quarter to $34.6 billion. The residential sector increased 3.4% to $21.2 billion, while the non-residential sector was up 7.3% to $13.5 billion.
All three non-residential components posted quarterly gains in the value of permits, with the institutional component rising 13.8% to a new quarterly record high of $4.5 billion. This was the fourth consecutive quarterly increase for the institutional component.
In the residential sector, 64,400 new units were authorized through building permits in the third quarter of 2023.
Specifically, 13,600 new single-family homes were authorized, 12.1% higher than the 12,200 authorized in the second quarter. This increase follows six consecutive quarterly declines in construction intentions for the single-family home component. Peterborough (+151.2% with 90 new units) was the CMA with the largest growth rate in the number of new single-family homes planned.
To explore data using an interactive user interface, visit the Building permits: Interactive Dashboard.
For more information on construction, please visit the Construction statistics portal.
For more information on housing, please visit the Housing statistics portal.
Statistics Canada has a Housing Market Indicators dashboard. This web application provides access to key housing market indicators for Canada, by province and by CMA. The indicators are updated automatically with new information from monthly releases, giving users access to the latest data.
Note to readers
Unless otherwise stated, this release presents seasonally adjusted data with current dollar values, which facilitate month-to-month and quarter-to-quarter comparisons by removing the effects of seasonal variations. For information on seasonal adjustment, see Seasonally adjusted data – Frequently asked questions.
Building components
- Single-family dwellings: Residential buildings containing only one dwelling unit (e.g., single-detached house, bungalow, linked home [linked at the foundation]).
- Multi-family dwellings: Residential buildings containing multiple dwelling units (e.g., apartment, apartment condominium, row house, semi-detached house).
- Industrial buildings: Buildings used in the processing or production of goods or related to transportation and communication.
- Commercial buildings: Buildings used in the trade or distribution of goods and services, including office buildings.
- Institutional and government buildings: Buildings used to house public and semi-public services, such as those related to health and welfare, education or public administration, and buildings used for religious services.
Revision
Data are subject to revisions based on late responses, methodological changes and classification updates. Unadjusted data have been revised for the previous month. Seasonally adjusted data have been revised for the previous three months.
For information on trend-cycle data, see the page Trend-cycle estimates – Frequently asked questions.
Next release
Data on building permits for October will be released on December 7.
Source: Statistics Canada
The Value of Membership

As the leading provider of in-depth business and credit information on the domestic lumber & forest products industry, a membership with Blue Book Services gives you access to:
- Ratings & Business Reports
- Dynamic Search Tools
- Real-Time Data