Statistics Canada: Investment in Building Construction, October 2023
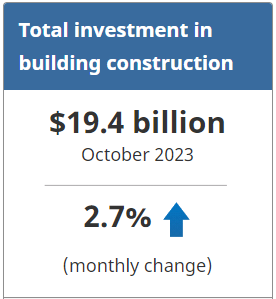
Investment in building construction rose 2.7% to $19.4 billion in October. The residential sector grew 3.9% to $13.4 billion, while investment in the non-residential sector was essentially flat, remaining at $6.0 billion.
On a constant dollar basis (2012=100), investment in building construction increased by 2.4% to $11.0 billion.
Strong gains in residential sector
Investment in residential building construction increased 3.9% month over month to $13.4 billion in October, with eight provinces reporting increases. The Prairie provinces, Manitoba (+16.2%), Saskatchewan (+11.5%) and Alberta (+9.5%), had the strongest gains, while Newfoundland and Labrador (-6.1%) saw the largest decline.
Investment in detached single family homes increased 3.1% to $6.5 billion, led by a 23.3% increase in Manitoba.
Multi-unit investment (apartments, semi-detached and row homes) rose 4.6% to $6.9 billion on strong growth across all provinces, with only Newfoundland and Labrador (-8.8%) and Quebec (-1.5%) posting declines.
Non-residential investment flat in October
Investment in the non-residential sector was essentially flat month over month, remaining at $6.0 billion in October. Gains in industrial (+1.0% to $1.2 billion) and institutional (+0.7% to $1.6 billion) investments were offset by declines in commercial investment (-0.7% to $3.2 billion).
Gains in the institutional sector were led by investments in hospital facilities. Investment in industrial facilities was led by the construction of an active cathode materials plant for the electric vehicle supply chain in Bécancour, Quebec.
For more information on construction, please visit the Construction statistics portal.
For more information on housing, please visit the Housing statistics portal.
Note to readers
Data are subject to revisions based on late responses, methodological changes and classification updates. Unadjusted data have been revised for the previous two months. Seasonally adjusted data have been revised for the previous three months.
Data presented in this release are seasonally adjusted with current dollar values unless otherwise stated. Using seasonally adjusted data allows month-to-month and quarter-to-quarter comparisons by removing the effects of seasonal variations. For information on seasonal adjustment, see Seasonally adjusted data – Frequently asked questions.
Monthly estimates for constant dollars are calculated using quarterly deflators from the Building Construction Price Index (18-10-0276-01). The monthly indexes used for the deflation process were part of a methodology review to increase the quality of the constant dollar and seasonally adjusted series. The indexes previously displayed a step pattern due to less frequent collection.
Detailed data on investment activity by type of building and type of work are now available in the unadjusted current dollar series.
The trade and services subcomponent includes buildings such as retail and wholesale outlets, retail complexes and motor vehicle show rooms. More detailed information can be found on the Integrated Metadatabase at Types of Building Structure – 2.2.1 – Trade and services.
Next release
Data on investment in building construction for November 2023 will be released on January 18, 2024.
Products
Statistics Canada has a “Housing Market Indicators” dashboard. This web application provides access to key housing market indicators for Canada, by province and census metropolitan area. These indicators are automatically updated with new information from monthly releases, giving users access to the latest data.
Source: Statistics Canada
The Value of Membership

As the leading provider of in-depth business and credit information on the domestic lumber & forest products industry, a membership with Blue Book Services gives you access to:
- Ratings & Business Reports
- Dynamic Search Tools
- Real-Time Data