Statistics Canada: Investment in Building Construction, November 2023
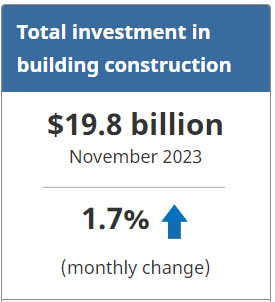
Investment in building construction rose 1.7% to $19.8 billion in November. The residential sector grew 2.2% to $13.7 billion, while investment in the non-residential sector edged up 0.4% to $6.0 billion.
On a constant dollar basis (2017=100), investment in building construction increased by 1.3% to $12.3 billion in November.
Investment in the residential sector rises
Investment in residential building construction increased 2.2% to $13.7 billion in November. The monthly increase in November was led by more activity in new construction in Nova Scotia (+10.4%), Alberta (+4.4%), Ontario (+4.1%), British Columbia (+2.3%) and Quebec (+1.0%). In Alberta, the monthly growth brought total investment in the residential sector to $2.0 billion in November, a record high in the province since the beginning of this series in January 2010.
These increases were partially offset by declines in the other provinces as the pace of new construction slowed from earlier in 2023.
Investment in detached single-family homes increased 1.2% to $6.6 billion in November, the fourth consecutive monthly increase. Meanwhile, investment in multi-unit buildings, which includes apartments, semi-detached and row homes, increased 3.1% to $7.2 billion.
Non-residential edges higher
Investment in the non-residential sector edged up 0.4% to $6.0 billion in November. Gains in institutional (+3.1% to $1.6 billion) and industrial (+1.0% to $1.3 billion) investments were mostly offset by the decline in commercial investment (-1.2% to $3.2 billion) in the month.
For more information on construction, please visit the Construction statistics portal.
For more information on housing, please visit the Housing statistics portal.
Note to readers
With this release, table 34-10-0175 has been archived on the Statistics Canada website and will no longer be updated, but may still be viewed. The successor table is 34-10-0286 and the information from January 2017 onwards that was in table 34-10-0175 is still available in the new table, except for the constant dollar series which have been rebased to 2017=100. Constant dollar data for January and February 2017 represent an average between the old base year (2012=100) and the new base year (2017=100) and should be used with caution. These 2017 data series will be backcasted and the figures will be revised with the release of our annual revision.
Data are subject to revisions based on late responses, methodological changes and classification updates. Unadjusted data have been revised for the previous two months. Seasonally adjusted data have been revised for the previous three months.
Data presented in this release are seasonally adjusted with current dollar values unless otherwise stated. Using seasonally adjusted data allows month-to-month and quarter-to-quarter comparisons by removing the effects of seasonal variations. For information on seasonal adjustment, see Seasonally adjusted data – Frequently asked questions.
Monthly estimates for constant dollars are calculated using quarterly deflators from the Building Construction Price Index (18-10-0276-01). The monthly indexes used for the deflation process were part of a methodology review to increase the quality of the constant dollar and seasonally adjusted series. The indexes previously displayed a step pattern due to less frequent collection.
Detailed data on investment activity by type of building and type of work are now available in the unadjusted current dollar series.
The trade and services subcomponent includes buildings such as retail and wholesale outlets, retail complexes and motor vehicle show rooms. More detailed information can be found on the Integrated Metadatabase at Types of Building Structure – 2.2.1 – Trade and services.
Next release
Data on investment in building construction for December 2023 will be released on February 15, 2024.
Products
Statistics Canada has a “Housing Market Indicators” dashboard. This web application provides access to key housing market indicators for Canada, by province and census metropolitan area. These indicators are automatically updated with new information from monthly releases, giving users access to the latest data.
Source: Statistics Canada
The Value of Membership

As the leading provider of in-depth business and credit information on the domestic lumber & forest products industry, a membership with Blue Book Services gives you access to:
- Ratings & Business Reports
- Dynamic Search Tools
- Real-Time Data