CoreLogic: Job Growth Continues to Drive Annual Home Price Gains in December

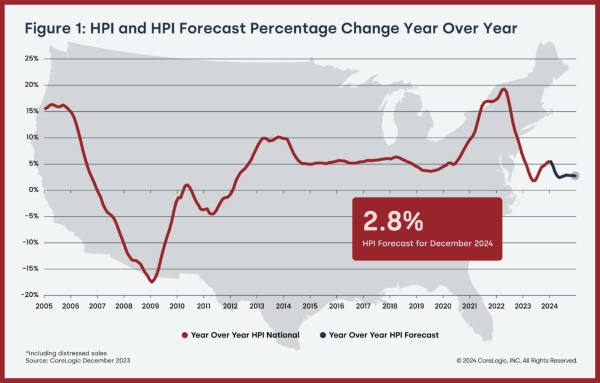
Annual U.S. home price growth was 5.5% in December 2023, the highest rate of appreciation recorded since January 2023.
Year-over-year U.S. home prices have recorded annual gains since early 2012.
In 2023, the average CoreLogic Home Price Index gain was 3.9%, down from 14.5% in 2022 but the same as the annual average in 2019.
Northeastern states continued to lead the U.S. for annual price gains, with Rhode Island on top at 13.3%.
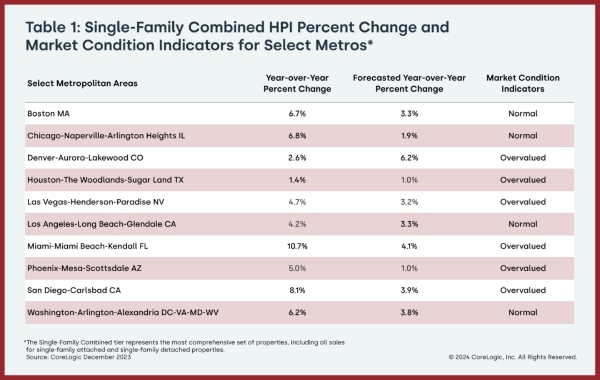
Among large metro areas, Miami returned to the No 1. spot for year-over-year home price increases in December, posting a gain of almost 11%.
CoreLogic®, a leading global property information, analytics and data-enabled solutions provider, released the CoreLogic Home Price Index (HPI™) and HPI Forecast™ for December 2023.
U.S. annual single-family home price growth continued its gradual upward momentum in December 2023 to 5.5%. Northeastern states still saw the largest gains, although no states or districts posted year-over-year losses, the first time that the latter trend has been observed since late 2022. As noted in CoreLogic’s most recent Loan Performance Index report, a healthy job market continues to drive mortgage performance and housing demand. In January 2024, the country added 353,000 new jobs, according to current U.S. Bureau of Labor Statistics data. These economic and housing market dynamics are happening while the inventory of homes for sale remains slim.
“Last winter’s mortgage rate surge impacted seasonal home price changes in many markets and suggests that annual gains may have reached the cycle peak and will level off in the coming months,” said Selma Hepp, chief economist for CoreLogic. “But while appreciation is projected to slow, home prices will continue to extend to new highs entering the typically busy spring homebuying season. Also, while the recent dip in mortgage rates help improve some affordability challenges, additional rate declines may not arrive until the second half of 2024.”
“The 2024 homebuying season should enjoy a boost because of pent-up demand, as well as a robust job market and wage growth,” Hepp continued. “Geographic patterns in price gains continued to favor housing markets in the Northeast and the South, especially those that remain more affordable and have lagged in home price increases over the past couple of years.”
Top Takeaways:
- U.S. single-family home prices (including distressed sales) increased by 5.5% year over year in December 2023 compared with December 2022. On a month-over-month basis, home prices declined by – 0.1% compared with November 2023.
- In December, the annual appreciation of detached properties (5.7%) was 1.1 percentage point higher than that of attached properties (4.6%).
- CoreLogic’s forecast shows annual U.S. home price gains slowing to 2.8% in December 2024.
- Miami posted the highest year-over-year home price increase of the country’s 20 tracked metro areas in December, at 10.7%. Detroit saw the next-highest gain (9.3%), followed by San Diego (8.1%).
- Among states, Rhode Island ranked first for annual appreciation in December (up by 13.3%), followed by New Jersey (up by 11.3%) and Connecticut (up by 10.5%). No states recorded year-over-year home price losses.
The next CoreLogic HPI press release, featuring January 2024 data, is scheduled to be issued on March 5, 2024, at 8 a.m. EST.
Methodology
The CoreLogic HPI™ is built on industry-leading public record, servicing and securities real-estate databases and incorporates more than 45 years of repeat-sales transactions for analyzing home price trends. Generally released on the first Tuesday of each month with an average five-week lag, the CoreLogic HPI is designed to provide an early indication of home price trends by market segment and for the Single-Family Combined tier, representing the most comprehensive set of properties, including all sales for single-family attached and single-family detached properties. The indices are fully revised with each release and employ techniques to signal turning points sooner. The CoreLogic HPI provides measures for multiple market segments, referred to as tiers, based on property type, price, time between sales, loan type (conforming vs. non-conforming) and distressed sales. Broad national coverage is available from the national level down to ZIP Code, including non-disclosure states.
CoreLogic HPI Forecasts™ are based on a two-stage, error-correction econometric model that combines the equilibrium home price—as a function of real disposable income per capita—with short-run fluctuations caused by market momentum, mean-reversion, and exogenous economic shocks like changes in the unemployment rate. With a 30-year forecast horizon, CoreLogic HPI Forecasts project CoreLogic HPI levels for two tiers — Single-Family Combined (both attached and detached) and Single-Family Combined Excluding Distressed Sales. As a companion to the CoreLogic HPI Forecasts, Stress-Testing Scenarios align with Comprehensive Capital Analysis and Review (CCAR) national scenarios to project five years of home prices under baseline, adverse and severely adverse scenarios at state, metropolitan areas and ZIP Code levels. The forecast accuracy represents a 95% statistical confidence interval with a +/- 2% margin of error for the index.
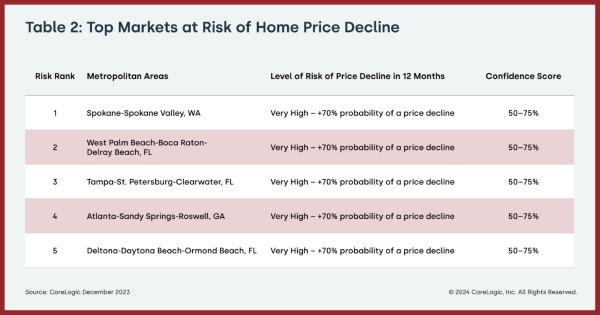
About Market Risk Indicators
Market Risk Indicators are a subscription-based analytics solution that provide monthly updates on the overall health of housing markets across the country. CoreLogic data scientists combine world-class analytics with detailed economic and housing data to help determine the likelihood of a housing bubble burst in 392 major metros and all 50 states. Market Risk Indicators is a multi-phase regression model that provides a probability score (from 1 to 100) on the likelihood of two scenarios per metro: a >10% price reduction and a = 10% price reduction. The higher the score, the higher the risk of a price reduction.
About the Market Condition Indicators
As part of the CoreLogic HPI and HPI Forecasts offerings, Market Condition Indicators are available for all metropolitan areas and identify individual markets as overvalued, at value or undervalued. These indicators are derived from the long-term fundamental values, which are a function of real disposable income per capita. Markets are labeled as overvalued if the current home price indexes exceed their long-term values by greater than 10% and undervalued where the long-term values exceed the index levels by greater than 10%.
About CoreLogic
CoreLogic is a leading provider of property insights and innovative solutions, working to transform the property industry by putting people first. Using its network, scale, connectivity and technology, CoreLogic delivers faster, smarter, more human-centered experiences that build better relationships, strengthen businesses and ultimately create a more resilient society. For more information, please visit www.corelogic.com.
CORELOGIC, the CoreLogic logo, CoreLogic HPI and CoreLogic HPI Forecast are trademarks of CoreLogic, Inc. and/or its subsidiaries. All other trademarks are the property of their respective owners.
Contact:
Robin Wachner – Media Contact – newsmedia@corelogic.com
Source: CoreLogic, Inc.
The Value of Membership

As the leading provider of in-depth business and credit information on the domestic lumber & forest products industry, a membership with Blue Book Services gives you access to:
- Ratings & Business Reports
- Dynamic Search Tools
- Real-Time Data