Statistics Canada: Investment in Building Construction, December 2023
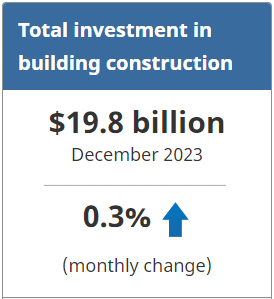
Investment in building construction edged up 0.3% month over month to $19.8 billion in December. The residential sector grew 0.3% to $13.8 billion, and investment in the non-residential sector rose 0.3% to $6.1 billion.
On a constant dollar basis (2017=100), investment in building construction was unchanged (+0.0%; +$5 million) at $12.2 billion in December.
Residential investment edges higher
Investment in residential building construction grew 0.3% to $13.8 billion in December. Gains in Quebec (+4.6%; +$107 million), Ontario (+1.4%; +$78 million), British Columbia (+0.9%; +$21 million) and Prince Edward Island (+11.9%; +$9 million) were partially offset by declines in the other six provinces, where the pace of new construction slowed from earlier in the year.
Meanwhile, investment in detached single-family homes declined 1.0% to $6.5 billion, while investment in multi-unit buildings, which includes apartments, semi-detached and row homes, increased 1.6% to $7.3 billion.
Non-residential investment increases slightly
Investment in the non-residential sector rose 0.3% to $6.1 billion in December. Increases were recorded in nine provinces, with only Newfoundland and Labrador (-2.9% to $24.8 million) reporting a decline.
Gains in the institutional (+3.4% to $1.7 billion) and industrial (+0.4% to $1.3 billion) components were mostly offset by a decline in commercial investment (-1.3% to $3.1 billion).
Fourth quarter summary
In the fourth quarter of 2023, investment in building construction grew 7.8% to $59.0 billion.
This quarterly increase was led by growth in the residential sector (+11.1% to $40.9 billion), which was responsible for over 95% of the total increase in investment for the quarter. Additionally, the increase in investment was broad-based, with eight provinces reporting strong gains. Prince Edward Island (-1.5% to $233.9 million) and Newfoundland and Labrador (-7.0% to $197.4 million) were the only provinces that reported declines in the fourth quarter.
Investment in the non-residential sector grew 1.1% to $18.1 billion in the fourth quarter. This marked a new high for the series and the 12th consecutive quarterly gain for the sector in Canada. Gains in the non-residential sector were driven by institutional (+7.5% to $4.9 billion) and industrial (+2.9% to $3.8 billion) investments, which were partially offset by the decline in commercial investment (-2.5% to $9.5 billion).
Annual summary for 2023
Year over year, investment in building construction declined 6.6% to $229.1 billion in 2023.
On a constant dollar basis (2017=100), the total value of investment in building construction fell 11.6% to $143.9 billion for the year.
The remainder of this release will be presented in constant dollars (2017=100) to focus on real changes to the value of investment in building construction.
The residential sector cooled off from 2022, declining 16.9% to $94.0 billion in 2023. This retreat was broad-based, with nine provinces posting declines. New Brunswick recorded a modest growth of 1.5% to $2.1 billion. This decline was led by the drop in the single-dwelling component (-22.7% to $46.2 billion), while investment in the multi-dwelling component declined at a lower rate (-10.6% to $47.7 billion).
The non-residential sector edged up 0.6% to $49.8 billion in 2023, the second consecutive annual increase. The gain in the industrial component (+11.5% to $9.5 billion) was mostly offset by declines in investment in the commercial (-1.9% to $27.1 billion) and institutional (-1.1% to $13.9 billion) components.
For more information on construction, please visit the Construction statistics portal.
For more information on housing, please visit the Housing statistics portal.
Note to readers
Table 34-10-0175 has been archived on the Statistics Canada website and will no longer be updated but may still be viewed. The successor table is 34-10-0286, and the information from January 2017 onwards that was in table 34-10-0175 is still available in the new table, except for the constant dollar series, which have been rebased to 2017=100. Constant dollar data for January and February 2017 represent an average between the old base year (2012=100) and the new base year (2017=100) and should be used with caution. These 2017 data series will be backcasted and the figures will be revised with the release of our annual revision.
Data are subject to revisions based on late responses, methodological changes and classification updates. Unadjusted data have been revised for the previous two months. Seasonally adjusted data have been revised for the previous three months.
Data presented in this release are seasonally adjusted with current dollar values unless otherwise stated. Using seasonally adjusted data allows month-to-month and quarter-to-quarter comparisons by removing the effects of seasonal variations. For information on seasonal adjustment, see Seasonally adjusted data – Frequently asked questions.
Monthly estimates for constant dollars are calculated using quarterly deflators from the Building Construction Price Index (18-10-0276-01). The monthly indexes used for the deflation process were part of a methodology review to increase the quality of the constant dollar and seasonally adjusted series. The indexes previously displayed a step pattern due to less frequent collection.
Detailed data on investment activity by type of building and type of work are now available in the unadjusted current dollar series.
The trade and services subcomponent includes buildings such as retail and wholesale outlets, retail complexes and motor vehicle show rooms. More detailed information can be found on the Integrated Metadatabase at Types of Building Structure – 2.2.1 – Trade and services.
Next release
Data on investment in building construction for January 2024 will be released on March 18, 2024.
Products
Statistics Canada has a “Housing Market Indicators” dashboard. This web application provides access to key housing market indicators for Canada, by province and census metropolitan area. These indicators are automatically updated with new information from monthly releases, giving users access to the latest data.
Source: Statistics Canada
The Value of Membership

As the leading provider of in-depth business and credit information on the domestic lumber & forest products industry, a membership with Blue Book Services gives you access to:
- Ratings & Business Reports
- Dynamic Search Tools
- Real-Time Data