CoreLogic: Annual US Home Price Growth Moves Up Gradually Again in January

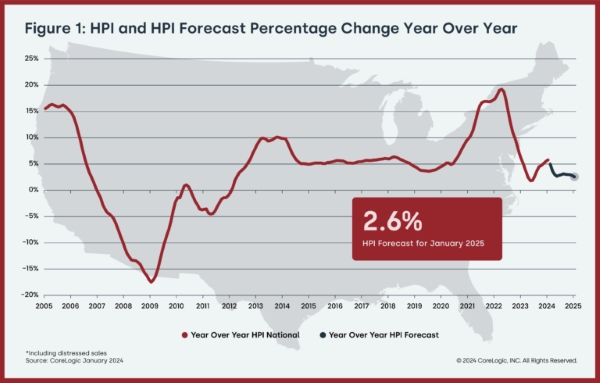
Nationwide, year-over-year single-family home price growth was 5.8% in January, the highest rate of appreciation expected this year
CoreLogic projects that annual home price growth will slow to 2.6% by January 2025
Rhode Island, New Jersey and Connecticut took the top three spots for annual home price gains for the fourth consecutive month
CoreLogic®, a leading global property information, analytics and data-enabled solutions provider, today released the CoreLogic Home Price Index (HPI™) and HPI Forecast™ for January 2024.
Year-over-year home price gains reached the highest rate in a year in January, but growth is expected to begin slowing in the coming months, falling to 2.6% by early 2025. Both higher mortgage rates and inventory shortages are exacerbating the nation’s long-running housing affordability problem, which particularly affects areas of the country where wages tend to be lower. Despite affordability issues, many younger Americans are finding a path to homeownership, with millennials accounting for more than half of home purchase applications between 2020 and 2023. Meanwhile, baby boomers who already have significant financial reserves can pay for homes entirely in cash, which further increases challenges for other buyers.
“U.S. annual home price growth strengthened to 5.8% in January 2024,” said Dr. Selma Hepp, chief economist for CoreLogic. “And while the acceleration continues to reflect the residual impact of strong appreciation in early 2023, the annual rate of growth is expected to taper off in coming months.”
“Home prices further increased in late 2023 despite high mortgage rates, which surged to the highest level since the beginning of the millennium,” Hepp continued. “But metro areas that have struggled with the impact of higher rates continue to see downward movement on home prices. Generally, pressures from higher mortgage rates tend to occur in markets where the higher cost of homeownership pushes against the affordability ceiling.”
Top Takeaways:
- U.S. single-family home prices (including distressed sales) increased by 5.8% year over year in January 2024 compared with January 2023. On a month-over-month basis, home prices increased by 0.1% compared with December 2023.
- In January, the annual appreciation of detached properties (6%) was 1.1 percentage points higher than that of attached properties (4.9%).
- CoreLogic’s forecast shows annual U.S. home price gains relaxing to 2.6% in January 2025.
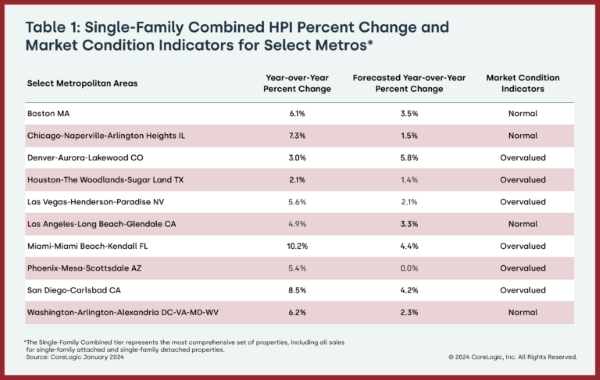
- Miami posted the highest year-over-year home price increase of the country’s 10 highlighted metro areas in January, at 10.2%. San Diego saw the next-highest gain at 8.5%.
- Among states, Rhode Island ranked first for annual appreciation in January (up by 13.2%), followed by New Jersey (up by 11.6%) and Connecticut (up by 11%). No states recorded year-over-year home price losses.
The next CoreLogic HPI press release, featuring February 2024 data, is scheduled to be issued on April 2, 2024, at 8 a.m. EST.
Methodology
The CoreLogic HPI™ is built on industry-leading public record, servicing and securities real-estate databases and incorporates more than 45 years of repeat-sales transactions for analyzing home price trends. Generally released on the first Tuesday of each month with an average five-week lag, the CoreLogic HPI is designed to provide an early indication of home price trends by market segment and for the Single-Family Combined tier, representing the most comprehensive set of properties, including all sales for single-family attached and single-family detached properties. The indices are fully revised with each release and employ techniques to signal turning points sooner. The CoreLogic HPI provides measures for multiple market segments, referred to as tiers, based on property type, price, time between sales, loan type (conforming vs. non-conforming) and distressed sales. Broad national coverage is available from the national level down to ZIP Code, including non-disclosure states.
CoreLogic HPI Forecasts™ are based on a two-stage, error-correction econometric model that combines the equilibrium home price—as a function of real disposable income per capita—with short-run fluctuations caused by market momentum, mean-reversion, and exogenous economic shocks like changes in the unemployment rate. With a 30-year forecast horizon, CoreLogic HPI Forecasts project CoreLogic HPI levels for two tiers — Single-Family Combined (both attached and detached) and Single-Family Combined Excluding Distressed Sales. As a companion to the CoreLogic HPI Forecasts, Stress-Testing Scenarios align with Comprehensive Capital Analysis and Review (CCAR) national scenarios to project five years of home prices under baseline, adverse and severely adverse scenarios at state, metropolitan areas and ZIP Code levels. The forecast accuracy represents a 95% statistical confidence interval with a +/- 2% margin of error for the index.
To view the original post, click here.
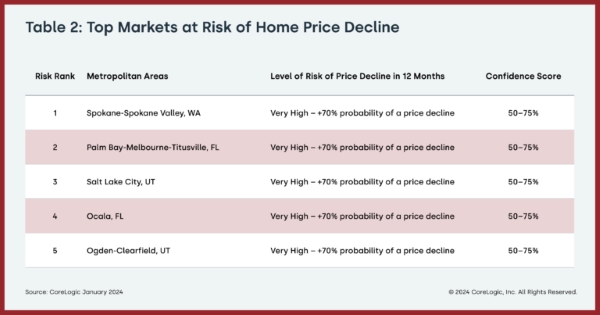
About Market Risk Indicators
Market Risk Indicators are a subscription-based analytics solution that provide monthly updates on the overall health of housing markets across the country. CoreLogic data scientists combine world-class analytics with detailed economic and housing data to help determine the likelihood of a housing bubble burst in 392 major metros and all 50 states. Market Risk Indicators is a multi-phase regression model that provides a probability score (from 1 to 100) on the likelihood of two scenarios per metro: a >10% price reduction and a = 10% price reduction. The higher the score, the higher the risk of a price reduction.
About the Market Condition Indicators
As part of the CoreLogic HPI and HPI Forecasts offerings, Market Condition Indicators are available for all metropolitan areas and identify individual markets as overvalued, at value or undervalued. These indicators are derived from the long-term fundamental values, which are a function of real disposable income per capita. Markets are labeled as overvalued if the current home price indexes exceed their long-term values by greater than 10% and undervalued where the long-term values exceed the index levels by greater than 10%.
About CoreLogic
CoreLogic is a leading provider of property insights and innovative solutions, working to transform the property industry by putting people first. Using its network, scale, connectivity and technology, CoreLogic delivers faster, smarter, more human-centered experiences that build better relationships, strengthen businesses and ultimately create a more resilient society. For more information, please visit www.corelogic.com.
CORELOGIC, the CoreLogic logo, CoreLogic HPI and CoreLogic HPI Forecast are trademarks of CoreLogic, Inc. and/or its subsidiaries. All other trademarks are the property of their respective owners.
Contact:
Robin Wachner – Media Contact – newsmedia@corelogic.com
Source: CoreLogic, Inc.
The Value of Membership

As the leading provider of in-depth business and credit information on the domestic lumber & forest products industry, a membership with Blue Book Services gives you access to:
- Ratings & Business Reports
- Dynamic Search Tools
- Real-Time Data