CoreLogic: February US Rent Growth Posts Highest Annual Increase Since Spring 2023

U.S. single-family rents rose by 3.4% year over year in February, the strongest growth recorded in 10 months
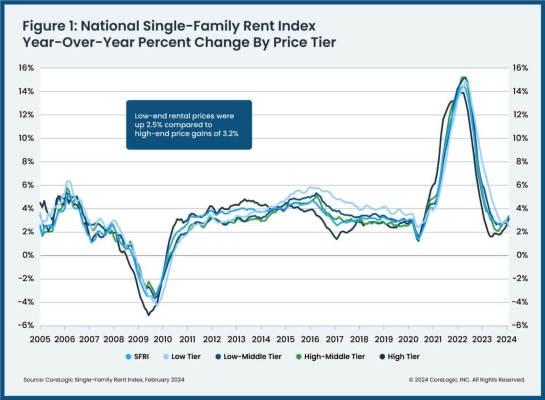
The higher-priced rent tier was the only one to see slightly larger annual gains (3.2%) compared with last February (3.1%)
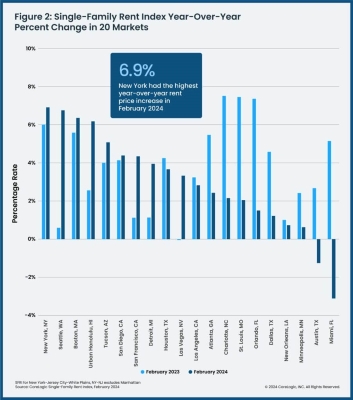
New York led the U.S. for year-over-year rent growth in February at 6.9%, while Miami (-3.1%) and Austin, Texas (-1.3%) saw losses
CoreLogic®, a leading global property information, analytics and data-enabled solutions provider, released its latest Single-Family Rent Index (SFRI), which analyzes single-family rent price changes nationally and across major metropolitan areas.
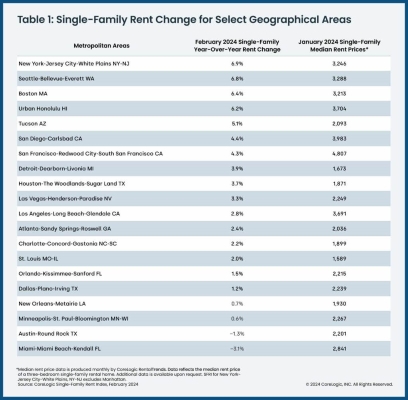
On a regional level, February’s annual rental cost increases could again signal that Americans are slowly migrating back to larger, more expensive coastal metros. New York saw the nation’s highest year-over-year rental price gain, followed by Seattle and Boston. Those metros had January median rent prices of more than $3,200 for a three-bedroom property, compared with the U.S. median of about $2,100. By contrast, in February 2023, less expensive metros led the country for rent growth, including St. Louis; Charlotte, North Carolina and Orlando, Florida.
“Single-family rent growth regained strength in February, posting the highest annual appreciation since April 2023,” said Molly Boesel, principal economist for CoreLogic. “Monthly rent growth also picked up in February and was higher than what is typically recorded in winter months. Lower-priced properties had the smallest annual rent growth in February, which should be welcome news to renters. However, properties in this price range have seen gains of more than 30% over the past four years, a slightly larger increase than those in the higher-priced range.”
To gain a detailed view of single-family rental prices across different market segments, CoreLogic examines four tiers of rental prices and two property-type tiers. National single-family rent growth across those tiers, and the year-over-year changes, were as follows:
- Lower-priced (75% or less than the regional median): up 2.5%, down from 7.3% in February 2023
- Lower-middle priced (75% to 100% of the regional median): up 3.1%, down from 5.7% in February 2023
- Higher-middle priced (100% to 125% of the regional median): up 3.1%, down from 4.4% inFebruary 2023
- Higher-priced (125% or more than the regional median): up 3.2%, a slight increase from the 3.1% recorded in February 2023
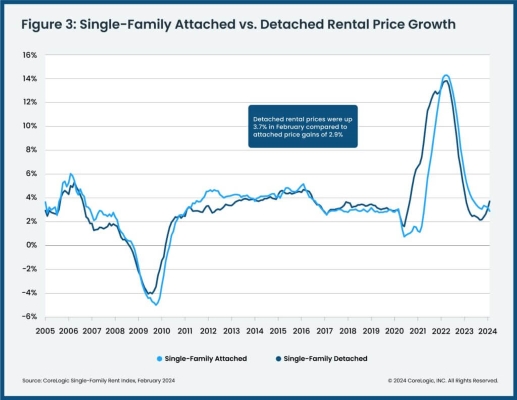
- Attached versus detached: Attached single-family rental prices grew by 2.9% year over year in February, compared with the 3.7% increase for detached rentals.
Of the 20 metros shown in Table 1, New York posted the highest year-over-year increase in single-family rents in February 2024, at 6.9%. Seattle registered the second-highest annual gain at 6.8%, followed by Boston at 6.4%. Miami (-3.1%) and Austin, Texas (-1.3%) posted annual rental price losses.
The next CoreLogic Single-Family Rent Index will be released on May 21, 2024, featuring data for March 2024. For ongoing housing trends and data, visit the CoreLogic Intelligence Blog: www.corelogic.com/intelligence.
Methodology
The single-family rental market accounts for half of the rental housing stock, yet unlike the multifamily market, which has many different sources of rent data, there are minimal quality adjusted single-family rent transaction data. The CoreLogic Single-Family Rent Index (SFRI) serves to fill that void by applying a repeat pairing methodology to single-family rental listing data in the Multiple Listing Service. The rental listings used to calculate the index include both attached and detached single-family homes, as well as condominiums. CoreLogic constructed the SFRI for close to 100 metropolitan areas — including 43 metros with four value tiers — and a national composite index. The indices are fully revised with each release to signal turning points sooner.
The CoreLogic Single-Family Rent Index analyzes data across four price tiers: Lower-priced, which represent rentals with prices 75% or below the regional median; lower-middle, 75% to 100% of the regional median; higher-middle, 100%-125% of the regional median; and higher-priced, 125% or more above the regional median.
Median rent price data is produced monthly by CoreLogic Rental Trends. Rental Trends is built on a database of more than 11 million rental properties (over 75% of all U.S. individual owned rental properties) and covers all 50 states and 17,500 ZIP codes.
About CoreLogic
CoreLogic is a leading provider of property insights and innovative solutions, working to transform the property industry by putting people first. Using its network, scale, connectivity and technology, CoreLogic delivers faster, smarter, more human-centered experiences that build better relationships, strengthen businesses and ultimately create a more resilient society. For more information, please visit www.corelogic.com.
CORELOGIC, the CoreLogic logo, CoreLogic HPI and CoreLogic HPI Forecast are trademarks of CoreLogic, Inc. and/or its subsidiaries. All other trademarks are the property of their respective owners.
Contact:
Robin Wachner – Media Contact – newsmedia@corelogic.com
Source: CoreLogic, Inc.
The Value of Membership

As the leading provider of in-depth business and credit information on the domestic lumber & forest products industry, a membership with Blue Book Services gives you access to:
- Ratings & Business Reports
- Dynamic Search Tools
- Real-Time Data