CoreLogic: US Mortgage Delinquency, Foreclosure Rates Hover Near Historic Lows in February

In February, the U.S. overall mortgage delinquency (2.8%), adverse delinquency (0.4%), foreclosure (0.3%) and transition rates (0.7%) were all unchanged from numbers recorded in February 2023
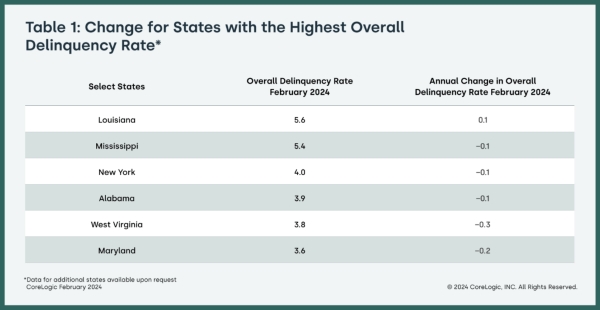
Four states posted small overall annual delinquency rate increases in February, eight saw no change and 39 showed year-over-year declines
The Kahului-Wailuku-Lahaina, Hawaii metro area continued to post the nation’s largest annual overall and serious delinquency increases due to last summer’s devastating wildfires in that region
CoreLogic®, a leading global property information, analytics and data-enabled solutions provider, released its monthly Loan Performance Insights Report for February 2024.
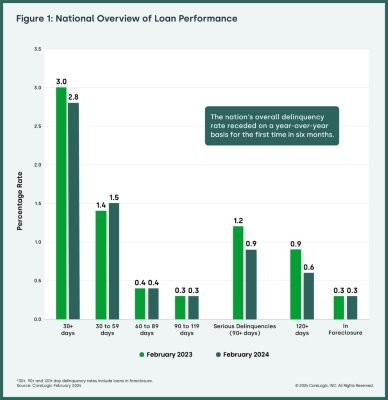
In February 2024, 2.8% of all mortgages in the U.S. were in some stage of delinquency (30 days or more past due, including those in foreclosure), down year-over-year from February 2023 and unchanged month over month from January 2024.
To gain a complete view of the mortgage market and loan performance health, CoreLogic examines all stages of delinquencies. In February 2024, the U.S. delinquency and transition rates and their year-over-year changes, were as follows:
- Early-Stage Delinquencies (30 to 59 days past due): 1.5%, up from 1.4% in February 2023.
- Adverse Delinquency (60 to 89 days past due): 0.4%, unchanged from February 2023.
- Serious Delinquency (90 days or more past due, including loans in foreclosure): 0.9%, down from 1.2% in February 2023 and from a high of 4.3% in August 2020.
- Foreclosure Inventory Rate (the share of mortgages in some stage of the foreclosure process): 0.3%, unchanged from February 2023.
- Transition Rate (the share of mortgages that transitioned from current to 30 days past due): 0.7%, unchanged from February 2023.
Most Americans with a mortgage are still able to make their payments on time, with nearly all stages of delinquency remaining near historic lows in February. Only four states posted small year-over-year overall delinquency rate increases, the fewest since late summer 2023. Even if homeowners who are current on their mortgage payments begin to struggle, substantial U.S. home equity growth — which was up by $1.3 trillion (8.6%) on an annual basis in the fourth quarter — should provide many with a financial cushion that will help them avoid falling into foreclosure.
“The U.S. delinquency rate fell from a year earlier for the first time in six months in February, indicating that mortgage performance remains strong,” said Molly Boesel, principal economist for CoreLogic. “The decrease in delinquencies was driven by the decline in the share of mortgages that were six months or more past due, a number that has been consistently shrinking and fell to its lowest level in 15 years in February.”
“As later-stage delinquencies decrease,” Boesel continued, “the share of mortgages in foreclosure remained at 0.3% in February, where it has been since March 2022 and only slightly higher than the all-time low.”
State and Metro Takeaways:
- Four states saw overall mortgage delinquency rates increase year over year in February. The state with the largest gain was Arizona (up by 0.2 percentage points). Eight states showed no change in overall delinquency rates year over year. The remaining states’ annual delinquency rates declined between -0.4 percentage points and -0.1 percentage points.
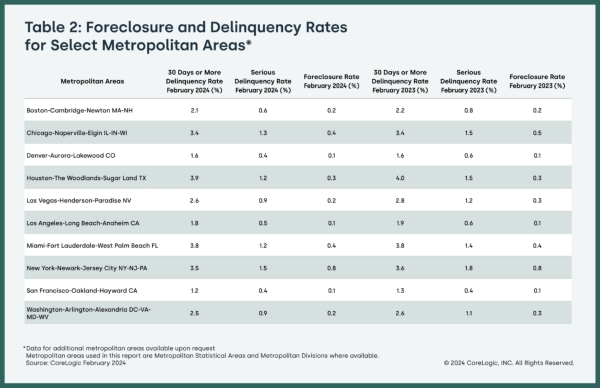
- In February, 56 U.S. metro areas posted increases in overall year-over-year delinquency rates. The metro with the largest delinquency rate increase was Kahului-Wailuku-Lahaina, Hawaii (up by 1.6 percentage points), followed by Hinesville, Georgia and New Orleans-Metairie, Louisiana (both up by 0.4 percentage points).
- In February, three U.S. metro areas posted an annual increase in serious delinquency rates (defined as 90 days or more late on a mortgage payment), while 25 metros recorded no change. Declines in other metros ranged from -1.7 percentage points to -0.1 percentage points. The metros that posted annual serious delinquency increases were Kahului-Wailuku-Lahaina, Hawaii (up by 1.6 percentage points), followed by Carson City, Nevada (up by 0.2 percentage points) and Hinesville, Georgia (up by 0.1 percentage points).
The next CoreLogic Loan Performance Insights Report will be released on May 30, 2024, featuring data for March 2024. For ongoing housing trends and data, visit the CoreLogic Intelligence Blog: www.corelogic.com/intelligence.
Methodology
The data in The CoreLogic LPI report represents foreclosure and delinquency activity reported through February 2024. The data in this report accounts for only first liens against a property and does not include secondary liens. The delinquency, transition and foreclosure rates are measured only against homes that have an outstanding mortgage. Homes without mortgage liens are not subject to foreclosure and are, therefore, excluded from the analysis. CoreLogic has approximately 75% coverage of U.S. foreclosure data.
About CoreLogic
CoreLogic is a leading provider of property insights and innovative solutions, working to transform the property industry by putting people first. Using its network, scale, connectivity and technology, CoreLogic delivers faster, smarter, more human-centered experiences that build better relationships, strengthen businesses and ultimately create a more resilient society. For more information, please visit www.corelogic.com.
CORELOGIC, the CoreLogic logo, CoreLogic HPI and CoreLogic HPI Forecast are trademarks of CoreLogic, Inc. and/or its subsidiaries. All other trademarks are the property of their respective owners.
Contact:
Robin Wachner – Media Contact – newsmedia@corelogic.com
Source: CoreLogic, Inc.
The Value of Membership

As the leading provider of in-depth business and credit information on the domestic lumber & forest products industry, a membership with Blue Book Services gives you access to:
- Ratings & Business Reports
- Dynamic Search Tools
- Real-Time Data