Statistics Canada: Investment in Building Construction, March 2025
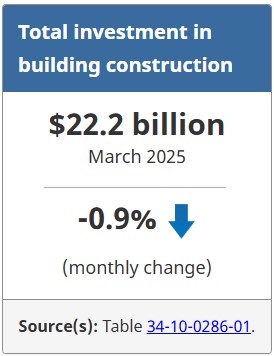
Overall, investment in building construction decreased 0.9% (-$192.2 million) to $22.2 billion in March. The residential sector declined 1.8% to $15.3 billion while the non-residential sector was up 1.3% to $6.8 billion. Year over year, investment in building construction grew 5.4% in March.
On a constant dollar basis (2017=100), investment in building construction decreased 0.8% from the previous month to $13.2 billion in March and was up 2.4% year over year.
Multi-unit component drags down residential sector
Investment in residential building construction decreased by $277.7 million to $15.3 billion in March. The decrease was driven by multi-unit construction (-3.8%) and tempered by single-family home investment (+0.5%).
Investment in multi-unit construction declined by $313.9 million to $8.0 billion in March. The monthly decline was largely attributed to Ontario (-$130.8 million) and Quebec (-$111.6 million). Meanwhile, New Brunswick (+$17.2 million) saw the largest increase, followed by three other provinces.
Single family home investment edged up by $36.2 million to $7.3 billion in March. Growth in five provinces and one territory, led by Quebec (+$131.6 million) and Manitoba (+$38.2 million), was largely mitigated by decreases in Ontario (-$96.8 million) and Alberta (-$53.1 million).
British Columbia leads growth in non-residential investment
Investment in non-residential construction increased by $85.5 million to $6.8 billion in March, marking the eighth consecutive monthly increase. The growth was spread across the three non-residential subsectors in March, with gains in the institutional (+2.4%), commercial (+1.0%), and industrial (+0.3%) components.
Investment in the institutional component grew by $47.4 million to $2.0 billion in March. Gains were recorded in seven provinces and two territories, led by Saskatchewan (+$18.5 million) and British Columbia (+$11.5 million).
Commercial construction investment rose by $32.9 million to $3.3 billion in March. Gains were led by British Columbia (+$26.2 million) and Ontario (+$11.6 million). Quebec (-$11.1 million) tempered the growth in the commercial component.
The industrial component edged up by $5.2 million to $1.5 billion in March. Declines were recorded in eight provinces and two territories, while growth was observed in Alberta (+$9.5 million) and Quebec (+$5.3 million) and in Yukon (+$0.2 million).
First quarter summary: Non-residential growth leads first quarter gains
Investment in building construction grew 3.3% to $66.6 billion in the first quarter of 2025. Year over year, investment in building construction grew 6.5% in the first quarter.
Investment in the non-residential sector was up 2.8% to $20.3 billion in the first quarter. The quarterly growth was largely due to gains in Ontario (+$401.4 million), along with seven other provinces and two territories. The overall institutional component recorded the largest increase (+5.6%), followed by the industrial component (+3.7%) and the commercial component (+0.8%).
Investment in the residential sector increased 3.5% to $46.3 billion in the first quarter, led by the multi-unit component (+6.5%), while single family home investment edged up 0.2%.
For more information on construction, please visit the Construction statistics portal.
For more information on housing, please visit the Housing statistics portal.
Note to readers
Table 34-10-0175 has been archived on the Statistics Canada website and will no longer be updated but may still be viewed. The successor table is 34-10-0286, and the information from January 2017 onwards that was in table 34-10-0175 is still available in the new table, except for the constant dollar series, which has been rebased to 2017=100. Constant dollar data for January and February 2017 represent an average between the old base year (2012=100) and the new base year (2017=100) and should be used with caution. The 2017 data series will be backcasted and the figures will be revised with the release of our annual revision.
Data are subject to revisions based on late responses, delayed construction start dates for large projects, methodological changes, classification updates, price index updates for constant dollar series, benchmarking and adjustments to ad hoc macroeconomic events. Unadjusted data have been revised back to January 2023. Seasonally adjusted data have been revised back to January 2017.
Data presented in this release are seasonally adjusted with current dollar values unless otherwise stated. Using seasonally adjusted data allows month-to-month and quarter-to-quarter comparisons by removing the effects of seasonal variations. For information on seasonal adjustment, see Seasonally adjusted data—Frequently asked questions.
Monthly estimates for constant dollars are calculated using quarterly deflators from the Building Construction Price Index (18-10-0276-01). The monthly indexes used for the deflation process were part of a methodology review to increase the quality of the constant dollar and seasonally adjusted series. The indexes previously displayed a step pattern because of less frequent collection.
Detailed data on investment activity by type of building and type of work are now available in the unadjusted current dollar series.
The trade and services subcomponent includes buildings such as retail and wholesale outlets, retail complexes and motor vehicle show rooms. More detailed information can be found on the Integrated Metadatabase at Types of Building Structure – 2.2.1 – Trade and services.
Next release
Data on investment in building construction for April will be released on June 19.
For the original release, click here.
Source: Statistics Canada
The Value of Membership

As the leading provider of in-depth business and credit information on the domestic lumber & forest products industry, a membership with Blue Book Services gives you access to:
- Ratings & Business Reports
- Dynamic Search Tools
- Real-Time Data