Statistics Canada: Building Permits, July 2025
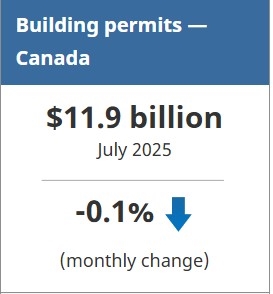
In July, the total value of building permits issued in Canada edged down $10.8 million (-0.1%) to $11.9 billion. Overall, the decrease in construction intentions was led by the non-residential sector (-$279.2 million), but this was largely offset by a rise in the residential sector (+$268.3 million).
On a constant dollar basis (2023=100), the total value of building permits issued in July declined 0.3% from the previous month and was down 8.2% on a year-over-year basis.
Decrease in industrial and institutional construction intentions leads to non-residential sector decline
The value of non-residential building permits decreased $279.2 million to $4.6 billion in July. The industrial (-$252.9 million) and institutional (-$196.0 million) components declined, while the commercial component (+$169.7 million) tempered the decrease.
In July, the decrease in the industrial component was primarily attributable to Ontario (-$190.9 million) and Quebec (-$114.8 million).
Alberta (-$192.1 million) led the decline in the institutional component, after hospital construction intentions in the province bolstered the national level in June. The decline in July was tempered by gains in Nova Scotia (+$65.9 million) and Quebec (+$57.8 million).
Gains in the commercial component in July were led by Ontario (+$82.5 million), followed by Quebec (+$59.3 million) and Nunavut (+$30.8 million). Meanwhile, the commercial component was down in five provinces, slightly moderating the gains.
Ontario drives residential sector increase
Despite the downward trend since January 2025, residential construction intentions rose $268.3 million to $7.3 billion in July. The national increase in the residential sector in July was driven by Ontario (+$497.5 million).
The single-family component increased $143.5 million to $2.6 billion in July, led by Ontario (+$114.6 million) and followed by Alberta (+$35.2 million). Overall, seven provinces and three territories contributed to the increase, while Quebec (-$17.2 million), Manitoba (-$12.5 million) and British Columbia (-$6.2 million) tempered the growth.
The multi-unit component grew $124.8 million to $4.7 billion and was driven by Ontario (+$382.8 million), specifically the Toronto census metropolitan area (+$329.5 million), followed by Alberta (+$84.7 million). The growth was partially offset by Quebec (-$160.0 million), Nova Scotia (-$57.2 million) and New Brunswick (-$55.0 million).
Nationwide, a total of 20,000 multi-unit dwellings and 4,100 single-family dwellings were authorized in July, up 1.9% from the previous month.
To explore data using an interactive user interface, visit the Building permits: Interactive Dashboard.
For more information on construction, please visit the Construction statistics portal.
For more information on housing, please visit the Housing statistics portal.
Note to readers
This Daily release was created with the assistance of a generative artificial intelligence tool, using data and analysis prepared by Statistics Canada analysts. The final content was verified by subject-matter experts.
Unless otherwise stated, this release presents seasonally adjusted data with current dollar values, which facilitate month-to-month and quarter-to-quarter comparisons by removing the effects of seasonal variations. For information on seasonal adjustment, see Seasonally adjusted data – Frequently asked questions.
For information on trend-cycle data, see the page Trend-cycle estimates – Frequently asked questions.
Data may not add up to totals as a result of rounding.
Building components
- Single-family dwellings: Residential buildings containing only one dwelling unit (e.g., single-detached house, bungalow, linked home [linked at the foundation]).
- Multi-family dwellings: Residential buildings containing multiple dwelling units (e.g., apartment, apartment condominium, row house, semi-detached house).
- Industrial buildings: Buildings used in the processing or production of goods or related to transportation and communication.
- Commercial buildings: Buildings used in the trade or distribution of goods and services, including office buildings.
- Institutional and government buildings: Buildings used to house public and semi-public services, such as those related to health and welfare, education or public administration, and buildings used for religious services.
Revision
Data are subject to revisions based on late responses, methodological changes and classification updates. Unadjusted data in current dollars have been revised for the previous month; unadjusted data in constant dollars have been revised for the previous two months. Seasonally adjusted data in current dollars have been revised for the previous two months; seasonally adjusted data in constant dollars have been revised for the previous three months.
Next release
Data on building permits for August will be released on October 14.
Source: Statistics Canada
The Value of Membership

As the leading provider of in-depth business and credit information on the domestic lumber & forest products industry, a membership with Blue Book Services gives you access to:
- Ratings & Business Reports
- Dynamic Search Tools
- Real-Time Data