CoreLogic: US Mortgage Delinquencies, Foreclosures Begin 2024 Exceptionally Low

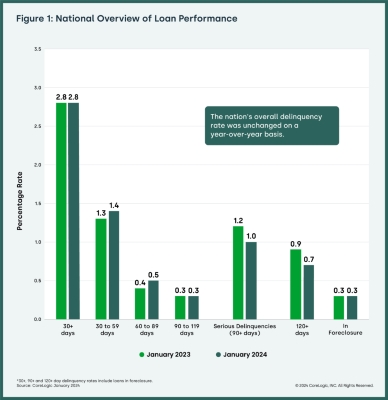
The U.S. housing market posted an overall mortgage delinquency rate of 2.8% in January, which remains near an all-time low.
Both the serious delinquency and foreclosure rates also hovered near historic lows in January, a respective 1% and 0.3%.
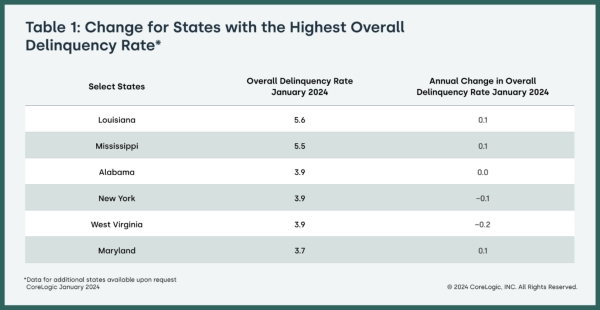
Twelve states saw overall mortgage delinquencies increase year over year in January; 19 posted no change and 20 saw slight declines.
CoreLogic®, a leading global property information, analytics and data-enabled solutions provider, released its monthly Loan Performance Insights Report for January 2024.
In January 2024, 2.8% of all mortgages in the U.S. were in some stage of delinquency (30 days or more past due, including those in foreclosure), unchanged year-over-year from January 2023 and down by -0.3 percentage points month over month from December 2023.
To gain a complete view of the mortgage market and loan performance health, CoreLogic examines all stages of delinquencies. In January 2024, the U.S. delinquency and transition rates and their year-over-year changes, were as follows:
- Early-Stage Delinquencies (30 to 59 days past due): 1.4%, up from 1.3% in January 2023.
- Adverse Delinquency (60 to 89 days past due): 0.5%, up from 0.4% in January 2023.
- Serious Delinquency (90 days or more past due, including loans in foreclosure): 1%, down from 1.2% in January 2023 and a high of 4.3% in August 2020.
- Foreclosure Inventory Rate (the share of mortgages in some stage of the foreclosure process): 0.3%, unchanged from January 2023.
- Transition Rate (the share of mortgages that transitioned from current to 30 days past due): 0.6%, unchanged from January 2023.
As was the case for most of 2023, U.S. mortgage delinquency and foreclosure rates remained near an all-time low in January. A thriving job market is helping many homeowners pay their mortgages on time, with the U.S. Bureau Of Labor Statistics putting the national unemployment rate at less than 4% for the past two years. Still, a dozen states and a substantial number of metro areas posted year-over-year increases in overall delinquency rates, indicating that the current employment situation does not benefit all Americans equally.
“Nationwide, the overall mortgage delinquency rate held steady in January, and the serious delinquency rate fell from a year ago,” said Molly Boesel, principal economist for CoreLogic. “However, one-third of metros posted an increase in the overall delinquency rate from one year earlier, and a handful reported an increase in serious delinquency rates.”
“While the sizable delinquency rate uptick in the Kahului-Wailuku-Lahaina, Hawaii metro is a result of last year’s wildfire,” Boesel continued, “increases in other areas of the country could be a sign that borrowers are experiencing budget strains.”
Top Takeaways:
- Twelve states saw overall mortgage delinquency rates increase year over year in January. The states with the largest gains were Hawaii and Idaho (both up by 0.2 percentage points). Nineteen states showed no change in overall delinquency rates year over year. The remaining states’ annual delinquency rates declined between -0.3 percentage points and -0.1 percentage points.
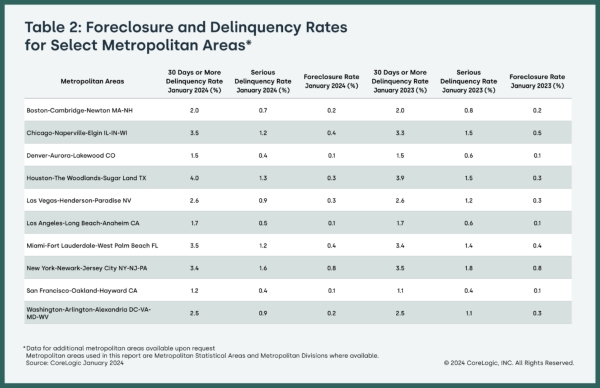
- In January, 124 U.S. metro areas posted increases in overall year-over-year delinquency rates. The metro with the largest delinquency rate increase was Kahului-Wailuku-Lahaina, Hawaii (up by 2 percentage points), followed by Jackson, Michigan and New Orleans-Metairie, Lousiana (both up by 0.6 percentage points).
- In January, four U.S. metro areas posted an annual increase in serious delinquency rates (defined as 90 days or more late on a mortgage payment), while 32 metros recorded no change. Declines in other metros ranged from -2 percentage points to -0.1 percentage points. The metros that posted annual serious delinquency increases were Kahului-Wailuku-Lahaina, Hawaii (up by 2 percentage points), followed by Albany-Lebanon, Oregon; Carson City, Nevada and Couer d’Alene, Idaho (all up by 0.1 percentage points).
The next CoreLogic Loan Performance Insights Report will be released on April 25, 2024, featuring data for February 2024. For ongoing housing trends and data, visit the CoreLogic Intelligence Blog: www.corelogic.com/intelligence.
Methodology
The data in The CoreLogic LPI report represents foreclosure and delinquency activity reported through January 2024. The data in this report accounts for only first liens against a property and does not include secondary liens. The delinquency, transition and foreclosure rates are measured only against homes that have an outstanding mortgage. Homes without mortgage liens are not subject to foreclosure and are, therefore, excluded from the analysis. CoreLogic has approximately 75% coverage of U.S. foreclosure data.
To view the original release, click here.
About CoreLogic
CoreLogic is a leading provider of property insights and innovative solutions, working to transform the property industry by putting people first. Using its network, scale, connectivity and technology, CoreLogic delivers faster, smarter, more human-centered experiences that build better relationships, strengthen businesses and ultimately create a more resilient society. For more information, please visit www.corelogic.com.
CORELOGIC, the CoreLogic logo, CoreLogic HPI and CoreLogic HPI Forecast are trademarks of CoreLogic, Inc. and/or its subsidiaries. All other trademarks are the property of their respective owners.
Contact:
Robin Wachner – Media Contact – newsmedia@corelogic.com
Source: CoreLogic, Inc.
The Value of Membership

As the leading provider of in-depth business and credit information on the domestic lumber & forest products industry, a membership with Blue Book Services gives you access to:
- Ratings & Business Reports
- Dynamic Search Tools
- Real-Time Data