Financial Statement Basics: Ratio Analysis

In our previous article (Part 1 of 2), we provided an overview of a company’s balance sheet. In this article (Part 2 of 2), we consider important balance sheet ratios.
The debt-to-equity ratio is computed by taking total debt and dividing by total equity. This ratio determines what percentage of a business’ assets are owned by the company versus lending institutions.
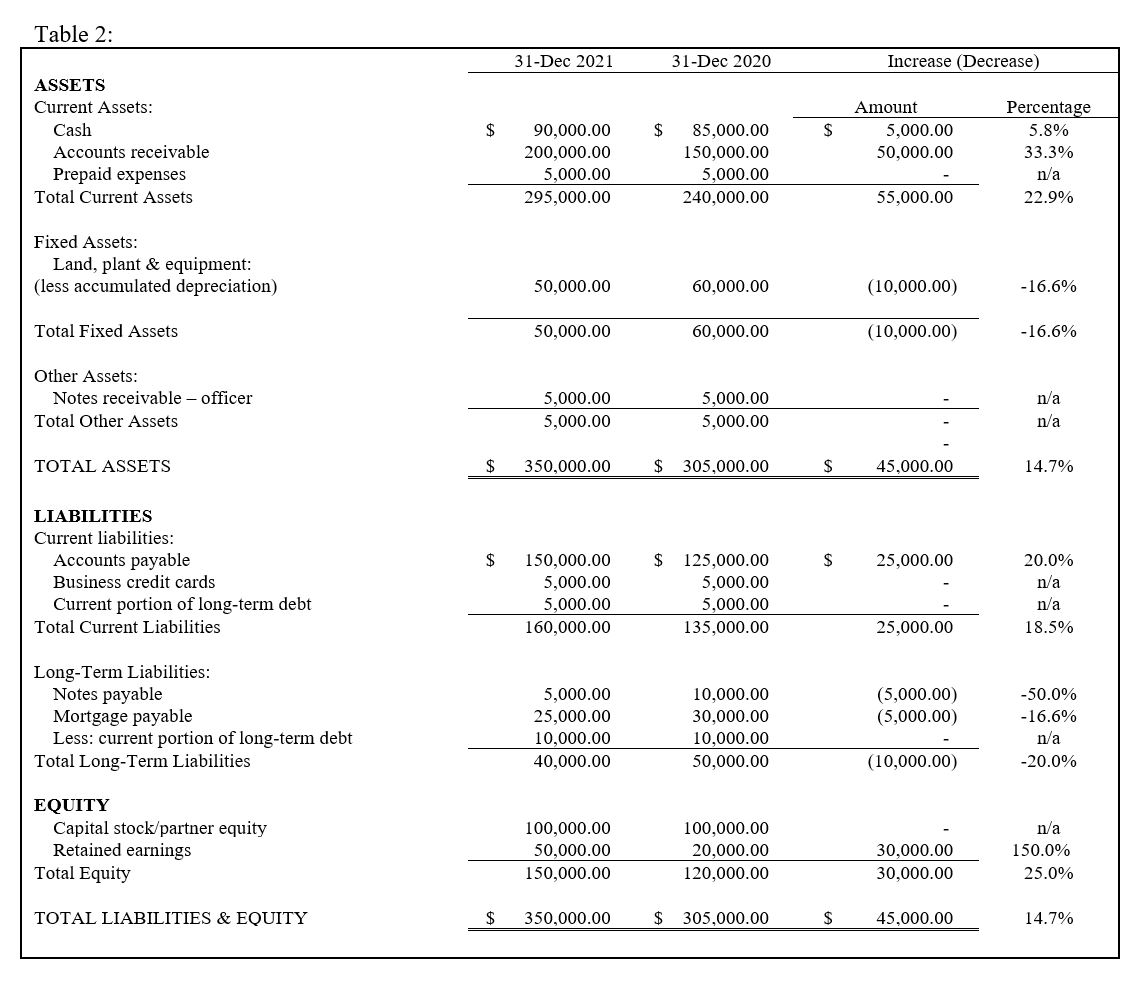
For the Table 2 balance sheet, the 2021 debt-to-equity ratio would be 1.33:1, or $200,000 over $150,000. This ratio shows that for every dollar of equity, the company has $1.33 of total debt.
How much is too much leverage? It comes down to historical performance and return on leveraged assets. And, from comparable viewpoint, understanding the industry and/or sector in which a company operates is useful as well.
A company that operates as an office wholesaler will likely have limited bank debt, while a stocking wholesaler or mill may have significant debt associated with and necessary for its operations.
The key to leverage is balancing current maturities and equity outpacing debt as a result of profitability.
Liquidity ratios measure the short-term ability of a company to pay its maturing obligations and unexpected cash needs. Balance sheet liquidity ratios include the current ratio and quick ratio.
A position closely linked to the current ratio is working capital, which is the total of current assets minus current liabilities. Working capital shows how many current assets are in excess of or deficient to current liabilities.
A positive working capital position is when current assets exceed current liabilities, and this is most preferred.
In Table 2, the working capital figure for December 31, 2021 is $295,000 minus $160,000, which equals $135,000.
Current Ratio
The current ratio expresses the relationship of current assets to current liabilities, by dividing current assets by current liabilities.
The current ratio for Table 2 as of December 31, 2021 is $295,000 divided by $160,000, or 1.84:1. This means that for every dollar of current liabilities, the company has $1.84 of current assets.
The current ratio is one measure of liquidity, but does not take into account the composition of current assets. For example, it would not identify slow-moving inventory or slow-to-convert accounts receivable.
A positive working capital position and current ratio are preferred. As mentioned, asset composition is sometimes an important factor when evaluating liquidity.
A negative working capital or current ratio suggests a company may have a difficult time paying maturing obligations.
Quick Ratio
Another liquidity ratio is the quick ratio, computed by taking cash, marketable securities, and accounts receivable and dividing by current liabilities.
The Table 2 quick ratio for December 31, 2021 would be cash of $90,000 plus accounts receivable of $200,000, divided by current liabilities of $160,000, equaling 1.81:1.
Depending on how a company operates and its current asset composition, a less-than-one relationship to current liabilities is quite possible.
The value of the quick ratio is that it shows cash and assets that can be converted to cash in approximately 30 to 90 days.
In most cases, the quick ratio will be smaller than the current ratio, given what each is accounting for. Comparing the two ratios is an important step as well—it provides some context and offers an indication of financial trends.
For example, in Table 2, the 2020 current and quick ratios are 1.78:1 and 1.74:1, respectively. Each of the 2021 liquidity ratios is higher than the 2020 ratios, indicating a positive direction. If the company operated effectively in 2020 with such ratios, it is reasonable to assume it performed consistently or better in 2021.
To read part 1, click here.
Source: Blue Book Services, Inc.
The Value of Membership

As the leading provider of in-depth business and credit information on the domestic lumber & forest products industry, a membership with Blue Book Services gives you access to:
- Ratings & Business Reports
- Dynamic Search Tools
- Real-Time Data